Lake Water Levels in Ontario
Water level records for Ontario lakes, Georgian Bay and the Great Lakes from the Water Survey of Canada’s gauges, the bodies that set the levels of regulated lakes, and the public sources for each day’s level.
Last updated 2026-09-28
- Ontario gauges in the archive
- 1,119580 of them active
- Lakes here with their own gauge
- 26 lakeseach named in its station
- Longest inland lake record
- 88 yearsLake Nipissing at North Bay, 1933 to 2025
- Yearly range, Lake Muskoka
- 0.91 mmedian at the Beaumaris gauge, 2003 to 2024
- Record range, Lake Huron at Parry Sound
- 2.43 mon Georgian Bay, 2012 low to 1986 high
- Most common highest month
- Mayat 11 of 26 lake gauges
Why Lake Levels Change Through the Year
A lake rises when more water flows in than leaves it, and falls when the outflow and evaporation exceed the inflow. Each spring the freshet, the runoff from melting snow and spring rain, raises the water, and at 21 of the 26 lake gauges tabled below the median level is highest in April, May or June.
On a lake held by a dam, the year also follows an operating plan. The operator lowers the lake through the fall and winter to leave room for the spring runoff, a practice called drawdown, lets the freshet refill it, and releases water through the summer to keep the rivers below it flowing. At 20 of the 26 gauges the median level is lowest in February or March, at the end of the winter. Mindemoya Lake and Sharbot Lake are lowest in September, after the summer.
At Beaumaris on Lake Muskoka, the median May level stands 62 centimeters above the median March level. On Lake Nipissing at North Bay the median June level stands 116 centimeters above the median March level. Lake Huron at Parry Sound, on Georgian Bay, peaks later, in July, 23 centimeters above its February level.
Gauges and Datums
A water level gauge records the height of the water surface at one place, measured against a fixed mark called the gauge datum. Of the 26 lake gauges tabled here, 20 read on an assumed datum, a local mark set when the gauge was installed. A reading of 9.75 meters at Beaumaris, the high of a median year there, is a height above that mark, so readings at one gauge compare with each other exactly, and readings at two gauges on assumed datums do not compare at all. The Great Lakes gauges read on the International Great Lakes Datum of 1985, one reference for all five lakes.
Who Sets Ontario Lake Levels
The levels of the regulated systems below are set by the province, by federal bodies, by a control board and by an international commission, each under a plan of its own.
The Muskoka River System
The Ministry of Natural Resources manages water levels on the Muskoka River under the Muskoka River Water Management Plan, a plan made under Ontario’s Lakes and Rivers Improvement Act. The watershed covers about 5,100 square kilometers, from the western slopes of Algonquin Park to Georgian Bay, and holds 42 water control structures and three navigation locks. The ministry owns and operates 29 of the structures, waterpower companies eleven, the District Municipality of Muskoka one and a private owner one. Many of the dams were first built from the late 1880s to the early 1900s to move logs and power mills, and many were rebuilt in concrete between 1940 and 1970. The plan replaced the operating strategies of the Hackner-Holden Agreement of 1940, and its current version is dated December 2024.
Each lake under the plan has an annual operating plan, a band of levels for each time of year called the normal operating range, with a preferred level inside it. Dam operators hold the lake within that band under normal conditions, and in a flood or a drought the level can pass above or below it. The ministry publishes operating plans for Kawagama Lake, Lake of Bays, Mary Lake, Lake Muskoka, Lake Rosseau, Lake Joseph and Skeleton Lake, and for the Huntsville lakes, Lake Vernon, Peninsula Lake and Fairy Lake. Outside the Muskoka watershed it publishes plans for Ahmic Lake, Lake Bernard, Lake Cecebe, Doe Lake and Kahshe Lake.
The plan reduces the winter drawdown on lakes where lake trout spawn, because eggs and young fish on shallow spawning beds were exposed when levels were lowered too far. When high water is expected, those lakes are lowered further to protect the shoreline.
The Trent-Severn Waterway
Parks Canada manages water levels on the Trent-Severn Waterway, a 386-kilometer canal between Lake Ontario and Georgian Bay, and across the Trent and Severn watersheds that supply it: 60 lakes, fifteen rivers and more than 250 wetlands, with 102 operating dams. More than 35 reservoir lakes in Haliburton and northern Peterborough counties are held for the waterway.
The Haliburton and Kawartha lakes are lowered through the fall and winter to make room for the spring melt. Through the summer the reservoir lakes are drawn down, each by the same percentage, to keep navigable depths on the waterway downstream. Lake Simcoe and Lake Couchiching follow a rule curve, a guide level for each time of year, in use since 1918.
Lake Nipissing and the French River
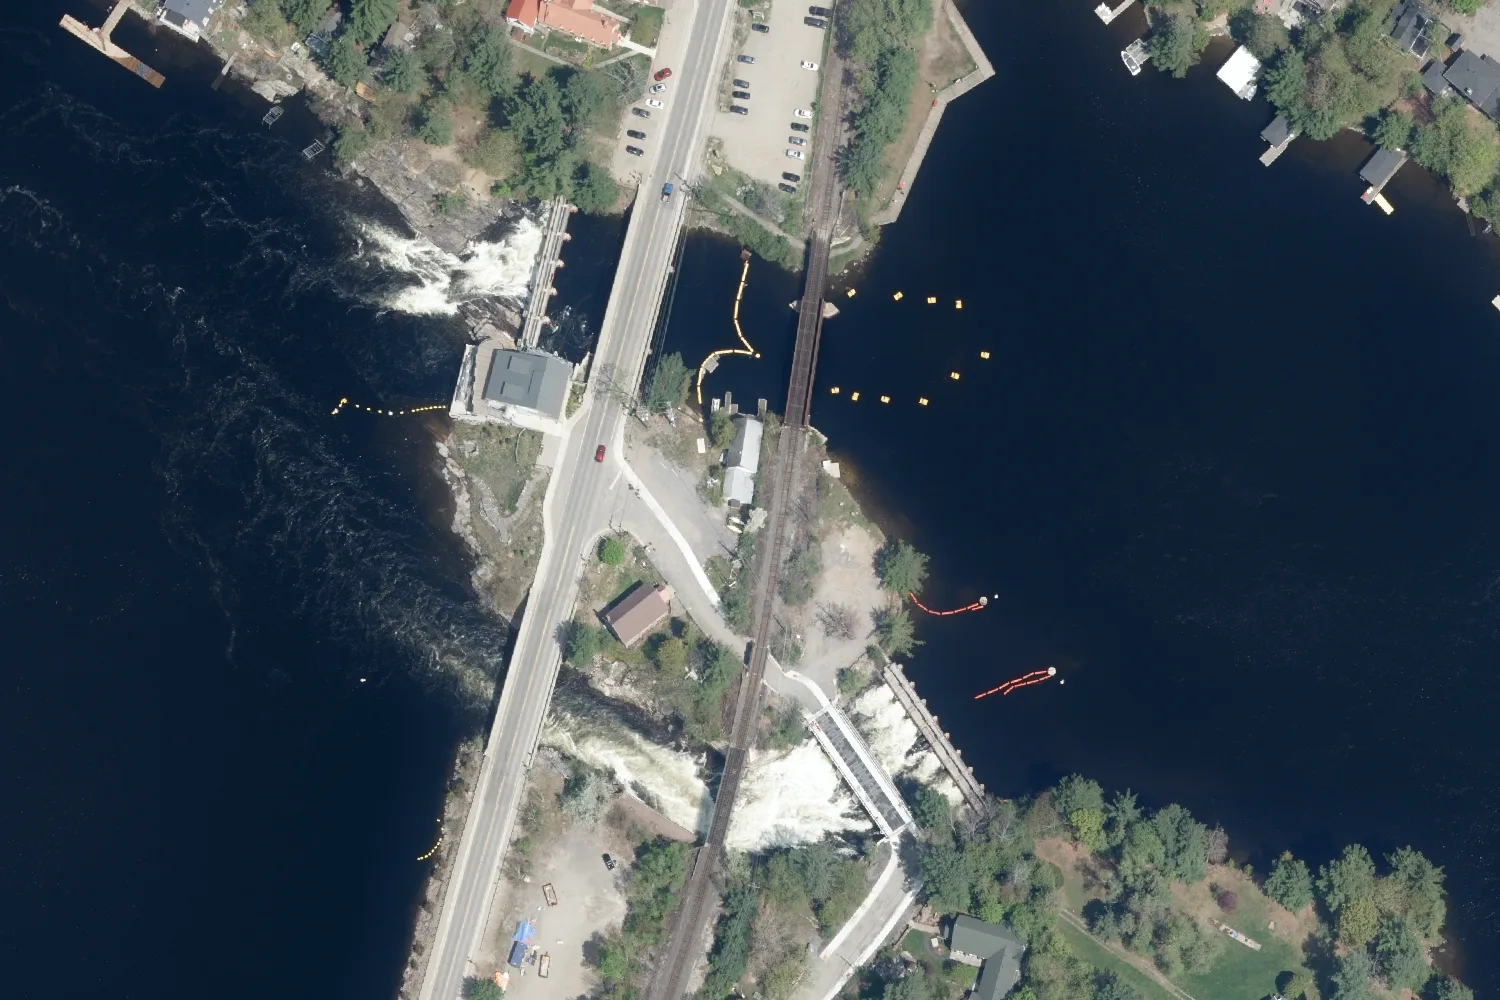
Public Services and Procurement Canada owns and operates three dams where the French River leaves Lake Nipissing, the Big Chaudière, Portage and Little Chaudière dams, which regulate the lake’s level and the flow into the river. Through the navigation season, from the May long weekend to mid-October, the department holds the lake within an operating band.
Lake of the Woods and Lac Seul
The Lake of the Woods Control Board regulates the levels of Lake of the Woods and Lac Seul, and the flows of the Winnipeg and English rivers below them. The gauge on Pelican Lake at Sioux Lookout is one the Board contributes to the national archive.
The Great Lakes
The International Joint Commission regulates two outflows from the Great Lakes. Lake Superior’s outflow through the St. Marys River has been regulated since 1921, under Plan 2012 since 2015, and Lake Ontario’s through the St. Lawrence River since 1960, under Plan 2014. Lake Michigan and Lake Huron meet at the Straits of Mackinac and stand at one level, reported as Lake Michigan-Huron. The Commission’s Lake Superior board describes the system’s levels as shaped mainly by precipitation, runoff, evaporation and wind.
Ontario Lakes with a Water Level Gauge
Twenty-six lakes tabled here carry a Water Survey of Canada gauge named for them, with at least five years of record in the national archive. The median range between a year’s highest and lowest level runs from 0.34 m on Kenogamisis Lake to 2.35 m on Wanapitei Lake.
Nineteen of the gauges were contributed by the Ministry of Natural Resources, which in Muskoka and Parry Sound shares the cost of automatic stations on many of the larger lakes with Environment Canada. Ontario Power Generation contributed the records for Lake Nipigon, Lake Temagami and Wanapitei Lake, both discontinued. Newer gauges on Sturgeon Lake (Kawartha Lakes) at Fenelon Falls, from 2022, Lake Nipissing at West Bay, from 2023 and Lake Scugog at Scugog Island Marina, from 2022, hold fewer than five years of record and are left out of the tables.
| Lake | Gauge | Years | Highest month | Lowest month | Range in a year |
|---|---|---|---|---|---|
| Ahmic LakeParry Sound District | near Ahmic Harbour02EA019 | 192006 to 2024 | April | March | 0.87 m |
| Doe LakeParry Sound District | near Katrine02EA016 | 212003 to 2025 | April | February | 1.78 m |
| Fairy LakeMuskoka | at Huntsville02EB016 | 232003 to 2025 | May | March | 0.89 m |
| Kawagama LakeHaliburton County | at Russell Landing02EB017 | 232003 to 2025 | May | March | 1.20 m |
| Kenogamisis LakeThunder Bay District | near Geraldton04JD006 | 202006 to 2025 | December | April | 0.34 m |
| Lac SeulKenora District | at Goldpines05QB003 | 841918 to 2025 | August | April | 1.85 m |
| Lake BernardParry Sound District | at Sundridge02EA020 | 182006 to 2025 | May | March | 0.50 m |
| Lake CecebeParry Sound District | at Magnetawan02EA015 | 232003 to 2025 | August | March | 0.65 m |
| Lake MuskokaMuskoka | at Beaumaris02EB018 | 202003 to 2024 | May | March | 0.91 m |
| Lake NipigonThunder Bay District | at Macdiarmid02AD007, discontinued | 641928 to 1994 | August | April | 0.77 m |
| Lake NipissingNipissing District | at North Bay02DD006 | 881933 to 2025 | June | March | 1.38 m |
| Lake of BaysMuskoka | at Baysville02EB019 | 222003 to 2024 | May | March | 0.90 m |
| Lake of the WoodsKenora District | at Keewatin05PE014 | 1111914 to 2024 | July | March | 0.82 m |
| Lake PanacheSudbury District | at Jackson's Point02CH002 | 192006 to 2024 | May | March | 0.50 m |
| Lake RosseauMuskoka | at Port Carling02EB020 | 202003 to 2024 | May | March | 0.66 m |
| Lake SimcoeSimcoe County, York and Durham | near Gamebridge02EC015, discontinued | 251961 to 1994 | May | February | 0.51 m |
| Lake TemagamiNipissing District | at Temagami02DC010, discontinued | 621932 to 1994 | June | March | 0.94 m |
| Mary LakeMuskoka | at Port Sydney02EB021 | 222003 to 2024 | May | March | 0.86 m |
| Mindemoya LakeManitoulin District | at Mindemoya02CG005 | 172008 to 2024 | May | September | 0.37 m |
| Pelican LakeKenora District | at Sioux Lookout05QA006 | 152010 to 2025 | June | March | 1.09 m |
| Porcupine LakeCochrane District | near Porcupine04MD005 | 232001 to 2024 | April | February | 1.30 m |
| Red LakeKenora District | at Forestry Point05QC005 | 182007 to 2025 | June | April | 0.41 m |
| Sharbot LakeFrontenac County | at the outlet of Sharbot Lake02KF020 | 202004 to 2025 | April | September | 0.59 m |
| Wanapitei LakeSudbury District | at Bowlands Bay02DA002, discontinued | 381954 to 1992 | June | March | 2.35 m |
| Watabeag LakeTimiskaming District | at Watabeag Lake Dam04MB005 | 152009 to 2024 | June | March | 0.68 m |
| White LakeThunder Bay District | at White Lake Provincial Park02BC007 | 172008 to 2024 | May | March | 1.83 m |
The Record at Each Gauge
The table below states each gauge’s levels on its own datum: the high and the low of the median year, and the highest and lowest daily levels in the whole record. The figures at one gauge compare with each other, and a figure at one gauge says nothing about a figure at another.
| Lake and gauge | Datum | Median year high | Median year low | Highest daily level | Lowest daily level |
|---|---|---|---|---|---|
| Ahmic Lakenear Ahmic Harbour | assumed datum | 9.00 m | 8.12 m | 9.60 mApr 24, 2019 | 7.92 mMar 31, 2014 |
| Doe Lakenear Katrine | assumed datum | 7.99 m | 6.34 m | 9.26 mApr 27, 2019 | 6.17 mMar 23, 2005 |
| Fairy Lakeat Huntsville | assumed datum | 6.86 m | 5.94 m | 7.66 mApr 25, 2019 | 5.77 mApr 11, 2003 |
| Kawagama Lakeat Russell Landing | assumed datum | 9.65 m | 8.49 m | 10.12 mApr 22, 2013 | 7.96 mMar 24, 2003 |
| Kenogamisis Lakenear Geraldton | assumed datum | 329.70 m | 329.36 m | 330.20 mMay 17, 2023 | 329.23 mSep 15, 2006 |
| Lac Seulat Goldpines | lac seul datum | 356.60 m | 354.58 m | 357.22 mSep 27, 1969 | 351.78 mApr 21, 1923 |
| Lake Bernardat Sundridge | assumed datum | 8.67 m | 8.21 m | 8.85 mMay 3, 2019 | 8.04 mMar 9, 2010 |
| Lake Cecebeat Magnetawan | assumed datum | 19.14 m | 18.47 m | 19.48 mJul 9, 2025 | 18.30 mApr 2, 2014 |
| Lake Muskokaat Beaumaris | assumed datum | 9.75 m | 8.84 m | 10.20 mApr 27, 2013 | 8.56 mMar 29, 2005 |
| Lake Nipigonat Macdiarmid | Geodetic Survey of Canada datum | 260.14 m | 259.34 m | 260.58 mJul 6, 1950 | 256.67 mJan 6, 1991 |
| Lake Nipissingat North Bay | assumed datum | 6.01 m | 4.62 m | 6.93 mJun 23, 1947 | 4.31 mApr 20, 1975, estimated |
| Lake of Baysat Baysville | assumed datum | 10.54 m | 9.67 m | 10.73 mApr 26, 2013 | 9.41 mMar 30, 2005 |
| Lake of the Woodsat Keewatin | lake of the woods datum | 323.21 m | 322.32 m | 324.29 mJun 30, 1916 | 321.55 mMar 6, 1925 |
| Lake Panacheat Jackson's Point | assumed datum | 31.32 m | 30.76 m | 31.62 mMay 4, 2023 | 30.51 mMar 13, 2015 |
| Lake Rosseauat Port Carling | assumed datum | 9.11 m | 8.50 m | 9.35 mApr 29, 2013 | 8.26 mMar 29, 2005 |
| Lake Simcoenear Gamebridge | assumed datum | 10.45 m | 9.95 m | 10.64 mJul 3, 1967 | 9.73 mFeb 11, 1961 |
| Lake Temagamiat Temagami | Geodetic Survey of Canada datum | 293.99 m | 293.05 m | 294.30 mJun 18, 1947 | 292.77 mMar 15, 1948 |
| Mary Lakeat Port Sydney | assumed datum | 8.91 m | 8.08 m | 9.52 mApr 27, 2019 | 7.93 mMar 21, 2003 |
| Mindemoya Lakeat Mindemoya | assumed datum | 6.68 m | 6.32 m | 6.83 mApr 13, 2023 | 6.22 mNov 23, 2016 |
| Pelican Lakeat Sioux Lookout | assumed datum | 357.77 m | 356.72 m | 358.75 mJun 24, 2014 | 356.51 mDec 6, 2023 |
| Porcupine Lakenear Porcupine | assumed datum | 98.66 m | 97.40 m | 99.29 mMay 2, 2013 | 97.27 mMar 9, 2020 |
| Red Lakeat Forestry Point | assumed datum | 355.95 m | 355.52 m | 356.59 mMay 22, 2022 | 355.44 mOct 6, 2008 |
| Sharbot Lakeat the outlet of Sharbot Lake | assumed datum | 1.53 m | 0.96 m | 1.80 mApr 18, 2014 | 0.79 mOct 15, 2016 |
| Wanapitei Lakeat Bowlands Bay | Geodetic Survey of Canada datum | 267.81 m | 265.39 m | 268.17 mJun 30, 1954 | 264.42 mApr 4, 1956 |
| Watabeag Lakeat Watabeag Lake Dam | approximate geodetic datum | 317.15 m | 316.33 m | 317.30 mMay 7, 2015 | 316.03 mMar 28, 2009 |
| White Lake (Thunder Bay District)at White Lake Provincial Park | assumed datum | 7.79 m | 5.95 m | 8.66 mMay 26, 2013 | 5.81 mMar 6, 2012 |
Muskoka Water Levels
Six lakes of the Muskoka River system carry gauges of their own: Lake Muskoka at Beaumaris, Lake Rosseau at Port Carling, Lake of Bays at Baysville, Fairy Lake at Huntsville, Mary Lake at Port Sydney and Kawagama Lake at Russell Landing. All six records begin in 2003.
The ministry reads the Port Carling gauge for both Lake Rosseau and Lake Joseph, and the Huntsville gauge on Fairy Lake for the Huntsville lakes, Lake Vernon, Peninsula Lake and Fairy Lake. It publishes a conversion for each gauge that relates the gauge’s reading to the levels on the lake’s operating plan.
Lake Muskoka at Beaumaris has a median range in a year of 0.91 m, lowest in March and highest in May. The highest daily level at the gauge is 10.20 meters on its datum, on April 27, 2013, and the lowest 8.56 meters, on March 29, 2005. Of the six, Kawagama Lake has the widest range, 1.20 m in a median year, and Lake Rosseau the narrowest, 0.66 m.
Across the gauges of Muskoka and Parry Sound District, the highest levels on record at Lake Muskoka, Lake Rosseau, Lake of Bays and Kawagama Lake all fall between April 22 and April 29, 2013, and those at Fairy Lake, Mary Lake, Ahmic Lake, Lake Bernard and Doe Lake between April 24 and May 3, 2019.
Lake Nipissing Water Levels
The gauge at North Bay holds the longest record among the inland lakes tabled here: 88 years with a recorded high and low between 1933 and 2025. The median range in a year is 1.38 m, from a low in March to a high in June.
The highest daily level at North Bay is 6.93 meters on the gauge’s assumed datum, on June 23, 1947, and the lowest 4.31 meters, on April 20, 1975, a value the archive marks as estimated. A median year runs from 4.62 to 6.01 meters. The lake’s level is regulated at the French River dams, described above.
Lake Simcoe and Trent-Severn Water Levels
Parks Canada publishes the current level of Lake Simcoe, Lake Couchiching and the other Trent-Severn lakes on its water level map, from hydrometric stations it operates itself, beside the average, highest and lowest levels in records reaching back to the late 1970s or early 1980s.
No active station in the national archive carries Lake Simcoe’s name. The Water Survey of Canada gauge near Gamebridge, on the east shore, recorded the lake for 25 years between 1961 and 1994. Its median range in a year is 0.51 m, lowest in February and highest in May, and its highest daily level falls on July 3, 1967.
Gauges in the national archive on Sturgeon Lake (Kawartha Lakes) at Fenelon Falls and Lake Scugog at Scugog Island Marina began recording in 2022, and their records are still too short to summarize.
Georgian Bay Water Levels
Georgian Bay is part of Lake Huron, and its gauges carry Lake Huron’s name. Three gauges in the national archive stand on the bay: Lake Huron at Collingwood, with monthly means from 1906, Lake Huron at Parry Sound, with a record from 1963, and Lake Huron at Midland, from 2012.
At the Parry Sound gauge the median level is lowest in February and highest in July, 23 centimeters apart, and the median range between a year’s highest and lowest daily level is 0.73 m. Across the years the range is far wider. The highest daily level at Parry Sound is 177.79 meters, on November 9, 1986, and the lowest 175.36 meters, on December 20, 2012, 2.43 m apart. Both are on the International Great Lakes Datum of 1985, on which Lake Huron’s chart datum, the reference level for depths on nautical charts, is 176.00 meters.
Averaged over the twelve months of each year with a full record at Collingwood, the lowest year is 1964, at 175.70 meters, and the highest 2020, at 177.29 meters.
Great Lakes Gauges in Ontario
| Gauge | Years | Highest month | Lowest month | Highest daily level | Lowest daily level |
|---|---|---|---|---|---|
| Lake Huron at CollingwoodGeorgian Bay, 02ED012 | 921918 to 2024 | July | March | 177.71 mNov 9, 1986 | 175.36 mJan 23, 1965 |
| Lake Huron at MidlandGeorgian Bay, 02ED033 | 132012 to 2024 | July | February | 177.50 mJul 20, 2020 | 175.35 mDec 20, 2012 |
| Lake Huron at Parry SoundGeorgian Bay, 02EA014 | 531963 to 2024 | July | February | 177.79 mNov 9, 1986 | 175.36 mDec 20, 2012 |
| Lake Superior at Thunder BayLake Superior, 02AB018 | 1001915 to 2024 | August | March | 183.97 mSep 10, 1916 | 182.71 mApr 16, 1926 |
| Lake Huron at GoderichLake Huron, 02FE012 | 981920 to 2024 | July | March | 177.61 mNov 9, 1986 | 175.45 mNov 28, 1964 |
| Lake Erie at Port ColborneLake Erie, 02HA017 | 1001913 to 2024 | June | February | 175.74 mDec 2, 1985 | 172.88 mMar 7, 1935 |
| Lake Ontario at TorontoLake Ontario, 02HC048 | 891911 to 2024 | June | November | 75.95 mJun 12, 2019 | 73.66 mDec 26, 1934 |
Where to See Today’s Water Level
The records on this page come from the national archive, which holds levels after quality checks. Each day’s level is published by the bodies below. Real-time readings are preliminary and can change before they enter the archive.
| Water | Published by | What it shows |
|---|---|---|
| The active lake gauges on this page, among 536 Ontario stations the archive marks as real-time | Water Office, Environment and Climate Change Canada | Each station’s recent readings. They are preliminary and pass through quality checks before entering the archive. |
| Lake Muskoka, Lake Rosseau, Lake Joseph, Lake of Bays, Kawagama Lake, Mary Lake and the Huntsville lakes | Muskoka Water Web, District of Muskoka, with the Ministry of Natural Resources | Each lake’s annual operating plan, and the ministry’s conversion from each gauge’s reading to the levels on that plan. |
| Lake Simcoe, Lake Couchiching, Lake Scugog, Sturgeon Lake (Kawartha Lakes), Canal Lake, Rice Lake and the other Trent-Severn lakes | Parks Canada, Trent-Severn Waterway water levels | Readings from Parks Canada’s own stations, the automated ones typically posted every 24 hours, beside the average, highest and lowest levels on record. |
| Lake Nipissing and the French River | Public Services and Procurement Canada | Water levels and flow conditions for the lake and the river below the dams. |
| Lake of the Woods, Lac Seul, Rainy Lake and the English and Winnipeg rivers | Lake of the Woods Control Board | Levels and flows at the Board’s sites, updated each workday and marked provisional. |
| Georgian Bay and the Great Lakes | LEVELnews, Environment and Climate Change Canada, and the Canadian Hydrographic Service monthly bulletin | Each lake’s monthly level against its long-term average, and against chart datum. |
Flood Messages
Ontario’s flood messages come from the province’s Surface Water Monitoring Centre, through ministry offices and the conservation authorities. The province names four kinds: a watershed conditions statement for flood outlook, a watershed conditions statement for water safety, a flood watch and a flood warning. Current messages appear on the province’s flood message map, and low water conditions on its low water map.
Common Questions
What is the water level of Lake Muskoka?
The Water Survey of Canada gauge at Beaumaris records Lake Muskoka’s level. Its median range in a year is 0.91 meters, lowest in March and highest in May. The day’s provisional reading is published on the federal Water Office site.
Why are lake levels lowered in the fall?
A lake held by a dam is drawn down through the fall and winter to leave room for the spring runoff. The Ministry of Natural Resources does this on the Muskoka River system and Parks Canada on the Trent-Severn lakes, each under its own plan.
When are Ontario lake levels highest?
At 21 of the 26 lake gauges tabled here the median level is highest in April, May or June, after the spring freshet, and May is the most common month, at 11. The Great Lakes peak later, and Lake Huron at Parry Sound is highest in July.
What is the water level of Lake Simcoe?
Parks Canada publishes Lake Simcoe’s current level on its Trent-Severn water level map. The lake is managed to a rule curve in use since 1918, and the federal gauge near Gamebridge recorded it from 1961 to 1994.
Who controls water levels on the Trent-Severn Waterway?
Parks Canada, across the Trent and Severn watersheds, with 102 operating dams and more than 35 reservoir lakes in Haliburton and northern Peterborough counties.
What is the water level of Georgian Bay?
Georgian Bay stands at the level of Lake Huron. At the Lake Huron at Parry Sound gauge, on the bay, the highest daily level on record is 177.79 meters, in 1986, and the lowest 175.36 meters, in 2012, on the International Great Lakes Datum 1985. LEVELnews reports each month’s level against the long-term average.
Who controls the water level of Lake Nipissing?
Public Services and Procurement Canada, through three dams at the head of the French River. Through the navigation season, from the May long weekend to mid-October, it holds the lake within an operating band.
What is a gauge datum?
A gauge datum is the fixed mark a gauge measures the water against. On an assumed datum the reading is a height above a local mark, so it compares only with other readings at the same gauge.
Where are flood warnings for Ontario lakes published?
The province’s Surface Water Monitoring Centre, ministry offices and the conservation authorities issue flood watches and flood warnings, and the current messages appear on the province’s flood message map.
How is the level read on a lake with no gauge?
A lake without a gauge of its own may be read through a connected lake, as Lake Joseph is through the Port Carling gauge. On smaller lakes in Muskoka and Parry Sound, the Ministry of Natural Resources works with cottage associations and volunteers who read the level.
The Buyer’s Report
The Rural & Cottage Buyer’s Report gathers what the public record holds about one property: shore road allowance, road access, wells, flood mapping, Crown land, wetlands and more. Where a Water Survey of Canada gauge carries the name of the property’s lake, the report charts that gauge’s record, each year from its lowest daily level to its highest. Every report is read and checked by a person before it is sent.
See what is in the report All lake pagesSmall print
- Gauge datums
- Every level on this page is its gauge’s reading on the datum the gauge’s record names. An assumed datum is a local mark set at the gauge, and a reading on it is a height above that mark with no relation to sea level or to the reading at any other gauge. Ranges, and departures from the middle of a gauge’s twelve monthly medians, are differences at one gauge and need no datum.
- A gauge and its lake
- A gauge records the water at its own station, often at a town dock or near a lake’s outlet. Wind, ice and the flow through narrows can hold the water in another part of the same lake higher or lower on the same day, and the reading at a dock or shoreline elsewhere on the lake is its own.
- Which lakes are tabled
- A lake is tabled only where a Water Survey of Canada station carries its name and stands within 5 kilometers of the lake’s outline in the Ontario Hydro Network, with at least five years of yearly highs and lows in the archive. A lake missing from the tables may be read by a gauge named for a connected lake, by a Parks Canada station, or by volunteers.
- Yearly figures
- Each year’s high and low are the highest and lowest daily mean levels in the archive for that year. The range in a year is the median, across the recorded years, of the difference between them. A month’s level is the median of that month’s mean across every recorded year. A year with no record is left blank, and the first and last year of a record may be partial. The archive marks some daily levels as estimated, and the tables say which.
- One reading withheld
- The archive holds a daily level of 256.94 meters at Wanapitei Lake on February 21, 1991, 8.8 meters below that month’s mean of 265.76 meters. That one reading is left out of the lake’s figures here, and the monthly means are unchanged.
- Operating plans
- The operating ranges, rule curves and targets on this page are summarized from the pages of the bodies that set them, read on September 28, 2026. Those bodies are the authority on them. Public Services and Procurement Canada’s page gives Lake Nipissing’s operating band without naming the datum it is measured on, so its figures cannot be read against the North Bay gauge and are not printed here.
- Today’s level and flooding
- Nothing on this page reports the level of any lake today. The archive’s latest year is 2025. A past high is a record and carries no prediction, and nothing here forecasts flooding or describes the flood hazard of any lake or shoreline. Flood messages are issued by the province and the conservation authorities.
- Water levels: Historical Hydrometric Data, Environment and Climate Change Canada, Water Survey of Canada, read through api.weather.gc.ca on October 2, 2026, open.canada.ca record 1ee9e14d-0814-5201-a3be-705809d8ee0e. Contains information licensed under the Open Government Licence – Canada. Data Source: Environment and Climate Change Canada.
- Matching gauges to lakes: Ontario Hydro Network waterbody outlines, Ministry of Natural Resources, Open Government Licence – Ontario.
- Muskoka River: Muskoka River Water Management Plan, Final Plan Report, Ontario Ministry of Natural Resources, and the ministry’s water management pages on Muskoka Water Web, District Municipality of Muskoka, read September 28, 2026.
- Trent-Severn Waterway: Parks Canada, Water Management InfoNet and the 2022 management plan, read September 28, 2026.
- Lake Nipissing: Public Services and Procurement Canada, French River dams, read September 28, 2026. Lake of the Woods and Lac Seul: Lake of the Woods Control Board.
- Great Lakes regulation: International Joint Commission, International Lake Superior Board of Control and International Lake Ontario-St. Lawrence River Board. Chart datum: Canadian Hydrographic Service, Fisheries and Oceans Canada, monthly water level bulletin.
- Flood messages: Government of Ontario, Surface Water Monitoring Centre, read September 28, 2026.