Lake Water Quality and Blue-Green Algae in Ontario
Phosphorus and water clarity at the province’s Lake Partner monitoring sites, the three trophic bands those readings are sorted into, and the record of 265 Ontario lakes, region by region. What causes blue-green algae, where a bloom is reported and who issues advisories, and the invasive species that change a lake’s water.
Last updated 2026-09-28
- Lake Partner sites
- 4,894in the province’s phosphorus and clarity files
- Sites sampled in 2025
- 1,077phosphorus readings, the latest year in the files
- Sites with a status
- 2,334three or more years of phosphorus
- Oligotrophic sites
- 54%1,262 of 2,334, under 10 µg/L
- Lakes with a site status
- 221 lakesof the 265 tabled below
- Report a suspected bloom
- 1-866-663-8477Spills Action Centre, 24 hours a day, 7 days a week
What Lake Water Quality Measures
The water quality of an Ontario lake is most often described by two readings: the concentration of total phosphorus in the water, and the depth at which a Secchi disk disappears from view. The province’s Lake Partner Program collects both, and its files hold 4,894 monitoring sites.
Phosphorus
Phosphorus is the nutrient that controls how much algae most Ontario lakes can grow. More phosphorus supports more algae, and more algae clouds the water. Total phosphorus is reported in micrograms per litre (µg/L): millionths of a gram in each litre of water, or parts per billion.
Some lakes are naturally richer in phosphorus than others. It also reaches a lake from shoreline erosion, from runoff off farms and towns, from sewage treatment plants and from septic systems that are not working properly.
Water Clarity and the Secchi Disk
A Secchi disk is a round black and white plate lowered on a marked line until it disappears from view. The depth at which it disappears is the Secchi depth, and a deeper reading means clearer water.
Algae cloud the water, and so do silt and the dissolved organic matter that stains many Shield lakes the colour of tea. Zebra mussels, which filter plankton out of the water, can leave a lake clearer. The province therefore judges a lake’s nutrient status by its phosphorus. Clarity readings record changes that phosphorus alone would miss, such as a zebra mussel invasion or a disturbance in the watershed.
How the Samples Are Taken
The readings are taken, mostly by volunteers, each at a fixed site, usually over the deepest water of a lake or bay. A sample from the surface of the open water is taken by the province to represent the phosphorus of the whole basin around it.
On a lake on the Canadian Shield a volunteer collects one sample in May, at spring turnover, when the lake has mixed from top to bottom after the ice has gone. On a lake off the Shield, samples are collected once or twice a month, May to October. Secchi readings are taken once or twice a month, May to October. The sample is filtered, sealed in two glass tubes and mailed to the Dorset Environmental Science Centre, where the province has analysed Lake Partner phosphorus since 2002. The two tubes are analysed separately, so a contaminated sample shows as a pair that disagrees.
Oligotrophic, Mesotrophic and Eutrophic Lakes
The province sorts lake water into three bands by its total phosphorus, with edges at 10 µg/L and 20 µg/L. A site receives a band once it holds three years of phosphorus readings, and the band is set by the average of those years.
- Oligotrophic, under 10 µg/L: dilute, unproductive water in which nuisance algal blooms are rare.
- Mesotrophic, 10 to 20 µg/L: a broad middle range, from clear, unproductive water near 10 to water that can carry moderate algal blooms near 20.
- Eutrophic, over 20 µg/L: productive water, which can carry persistent nuisance algal blooms.
Across Ontario, 2,334 Lake Partner sites hold a status: 1,262 oligotrophic, 839 mesotrophic and 233 eutrophic. Half of them average less than 9.5 µg/L, and 51 percent average between 4 and 10 µg/L.
Water Quality Across a Single Lake
A large lake is sampled at several sites, and its sites can read differently. Of the 168 lakes tabled below with two or more sites holding a status, 52 have sites in more than one band.
Lake Muskoka has 21 registered sites, nine of them with a status. Their averages run from 5.83 µg/L at site 2465/19, Dudley Bay deep spot, to 10.57 µg/L at site 2465/9, Muskoka Bay-CliffBay. A bay that receives a creek or a town’s runoff can read differently from open water half a kilometer away.
Water Quality by Lake
The tables below cover 265 Ontario lakes, grouped by region. On 221 of them at least one Lake Partner site holds a status, and each is given with the site that has the longest phosphorus record: its band, its long-term phosphorus average, the years it was sampled and the median of its Secchi readings.
Twenty-five lakes have registered sites with fewer than three years of phosphorus readings, and nineteen have no registered site. Each lake’s page tables every site on it that holds a status.
Muskoka Lake Water Quality
Lake Partner sites with a status lie on 22 of the 25 Muskoka lakes below. In all, 63 sites hold one: 42 oligotrophic, sixteen mesotrophic and five eutrophic.
| Lake | Site | Band | Phosphorus, µg/L | Years sampled | Median Secchi | Sites with a status |
|---|---|---|---|---|---|---|
| Bella LakeMuskoka | 319/2Mid Lake, deep spot | oligotrophic | 6.58 | 23to 2025 | 5.0 m298 readings | 1 of 2 |
| Bigwind LakeMuskoka | 413/1S/W of Burnt Is. | oligotrophic | 6.43 | 21to 2022 | 4.5 m141 readings | 1 of 1 |
| Buck LakeMuskoka | 617/2Deep spot, S end | mesotrophic | 11.14 | 19to 2025 | 1.8 m50 readings | 1 of 2 |
| Fairy LakeMuskoka | 1420/5Deepspot-NWAntlerIs. | oligotrophic | 8.91 | 14to 2025 | 2.5 m86 readings | 6 of 15 |
| Gibson LakeMuskoka | 1644/3SofNarrows-Deep Spot | mesotrophic | 12.27 | 11to 2021 | 2.2 m13 readings | 1 of 3 |
| Gloucester PoolMuskoka | 1666/1Mid Lake, deep spot | mesotrophic | 10.93 | 3to 2025 | 4.8 m14 readings | 1 of 6 |
| Lake JosephMuskoka | 2460/10Gordon Bay, deep spot | oligotrophic | 4.47 | 9to 2025 | 5.65 m6 readings | 2 of 12 |
| Kahshe LakeMuskoka | 2217/4Kluey's Bay | mesotrophic | 10.81 | 22to 2025 | 3.0 m202 readings | 5 of 7 |
| Lake of BaysMuskoka | 2469/12Little Trading Bay | oligotrophic | 5.53 | 12to 2021 | 4.0 m53 readings | 5 of 17 |
| Mary LakeMuskoka | 3032/2N of Crown Is. | oligotrophic | 7.88 | 24to 2025 | 3.2 m161 readings | 2 of 3 |
| Morrison LakeMuskoka | 3331/3S of Bell Is. | oligotrophic | 8.95 | 20to 2025 | 2.7 m126 readings | 3 of 4 |
| Lake MuskokaMuskoka | 2465/17MuskokaBay-Greavette | oligotrophic | 9.9 | 20to 2025 | 3.1 m100 readings | 9 of 21 |
| Peninsula LakeMuskoka | 4309/2Stn 2, Wolf Bay | mesotrophic | 10.08 | 22to 2025 | 4.3 m306 readings | 1 of 15 |
| Riley LakeMuskoka | 4628/1Mid Lake, deep spot | mesotrophic | 15.03 | 22to 2025 | 1.9 m101 readings | 1 of 1 |
| Lake RosseauMuskoka | 2476/1CentralW-WellesleyIs | oligotrophic | 6.86 | 14to 2021 | 4.3 m91 readings | 6 of 18 |
| Six Mile LakeMuskoka | 4978/1Cedar Nook | oligotrophic | 9.6 | 20to 2025 | 5.0 m205 readings | 1 of 5 |
| Skeleton LakeMuskoka | 4982/1Main Basin-deep spot | oligotrophic | 4.17 | 22to 2025 | 9.2 m207 readings | 2 of 5 |
| Sparrow LakeMuskoka | 5094/5Deep Bay, deep spot | mesotrophic | 11.51 | 11to 2025 | 4.8 m7 readings | 2 of 6 |
| Stewart LakeMuskoka | 5166/2mid lake, deep spot | oligotrophic | 6.65 | 8to 2017 | 3.0 m13 readings | 1 of 2 |
| Three Mile LakeMuskoka | 5362/6Mid Lake, deep spot | eutrophic | 22.67 | 22to 2025 | 1.4 m116 readings | 7 of 8 |
| Lake VernonMuskoka | 6455/10W side of Big Island | mesotrophic | 10.95 | 16to 2025 | 2.2 m11 readings | 4 of 20 |
| Wood LakeMuskoka | 5961/1Mid Lake, deep spot | oligotrophic | 7.04 | 22to 2025 | 3.6 m193 readings | 1 of 1 |
Bass Lake (Muskoka), Butterfly Lake and Dotty Lake have registered sites with fewer than three years of phosphorus readings.
Haliburton Lake Water Quality
Lake Partner sites with a status lie on 33 of the 35 Haliburton lakes below. In all, 64 sites hold one: 60 oligotrophic and four mesotrophic.
| Lake | Site | Band | Phosphorus, µg/L | Years sampled | Median Secchi | Sites with a status |
|---|---|---|---|---|---|---|
| Beech LakeHaliburton County | 302/2Mid lake, deep spot | oligotrophic | 8.14 | 14to 2025 | 4.2 m105 readings | 2 of 3 |
| Big Hawk LakeHaliburton County | 375/3Mid Lake, deep spot | oligotrophic | 4.64 | 17to 2025 | 6.0 m92 readings | 2 of 6 |
| Bob LakeHaliburton County | 505/4N end, deep spot | oligotrophic | 6.05 | 10to 2024 | 4.4 m78 readings | 2 of 4 |
| Boshkung LakeHaliburton County | 539/1Mid Lake, deep spot | oligotrophic | 6.76 | 10to 2013 | 5.5 m84 readings | 2 of 4 |
| Canning LakeHaliburton County | 727/1Mid Lake, deep spot | oligotrophic | 6.78 | 20to 2025 | 4.3 m205 readings | 1 of 1 |
| Davis LakeHaliburton County | 1117/1Mid Lake, deep spot | oligotrophic | 7.8 | 22to 2025 | 4.3 m253 readings | 1 of 2 |
| Drag LakeHaliburton County | 1246/4Main Basin-deep spot | oligotrophic | 6.34 | 18to 2021 | 5.75 m130 readings | 1 of 4 |
| Eagle LakeHaliburton County | 1297/1Mid Lake, deep spot | oligotrophic | 5.37 | 12to 2019 | 5.0 m65 readings | 1 of 2 |
| Esson LakeHaliburton County | 1401/1E end, deep spot | oligotrophic | 6.13 | 15to 2017 | 7.0 m92 readings | 3 of 5 |
| Gooderham LakeHaliburton County | 1683/1Mid Lake, deep spot | oligotrophic | 6.52 | 9to 2011 | 5.8 m58 readings | 1 of 2 |
| Gull LakeHaliburton County | 1790/5NW Basin-Rackety Crk | oligotrophic | 5.59 | 15to 2025 | 5.2 m11 readings | 2 of 8 |
| Haliburton LakeHaliburton County | 1830/1Mid Lake, deep spot | oligotrophic | 4.32 | 11to 2022 | 6.1 m38 readings | 2 of 6 |
| Halls LakeHaliburton County | 1837/2East Side-Halls Lake | oligotrophic | 4.78 | 18to 2025 | 7.0 m99 readings | 2 of 3 |
| Horseshoe LakeHaliburton County | 6006/1Main Basin-deep spot | oligotrophic | 6.02 | 23to 2025 | 6.1 m108 readings | 3 of 6 |
| Kashagawigamog LakeHaliburton County | 2238/1StnA-S-end Puffers Is. | oligotrophic | 7.42 | 20to 2025 | 4.75 m82 readings | 2 of 11 |
| Kawagama LakeHaliburton County | 2252/1Stn 1-Minden Bay | oligotrophic | 4.42 | 24to 2025 | 5.3 m191 readings | 5 of 7 |
| Kennisis LakeHaliburton County | 2293/3Deep spot, West end | oligotrophic | 3.79 | 18to 2025 | 6.05 m172 readings | 2 of 8 |
| Kushog LakeHaliburton County | 2373/1Mid Lake, deep spot | oligotrophic | 5.27 | 23to 2024 | 4.5 m111 readings | 4 of 6 |
| Little Kennisis LakeHaliburton County | 2655/1Mid Lake, deep spot | oligotrophic | 5.0 | 18to 2025 | 3.3 m155 readings | 1 of 3 |
| Maple LakeHaliburton County | 2982/3Mid Lake, deep spot | oligotrophic | 8.15 | 24to 2025 | 4.5 m223 readings | 1 of 2 |
| Miskwabi LakeHaliburton County | 6553/1E end, bay and shore | oligotrophic | 5.89 | 20to 2025 | 8.1 m210 readings | 2 of 3 |
| Moore LakeHaliburton County | 3309/2Mid Lake, deep spot2 | oligotrophic | 6.62 | 22to 2024 | 5.0 m251 readings | 3 of 5 |
| Mountain LakeHaliburton County | 3354/3S end, deep spot | oligotrophic | 5.55 | 24to 2025 | 6.0 m127 readings | 1 of 4 |
| Oxtongue LakeHaliburton County | 4214/6MidLakeDeepSpotOXT-0 | oligotrophic | 7.44 | 13to 2025 | 3.0 m33 readings | 2 of 6 |
| Paudash LakeHaliburton and Hastings County | 4271/3Joe Bay | oligotrophic | 6.0 | 12to 2022 | 4.95 m38 readings | 1 of 6 |
| Percy LakeHaliburton County | 4318/1N end, Mid-lake | oligotrophic | 5.98 | 14to 2023 | 4.5 m84 readings | 3 of 4 |
| Raven LakeHaliburton County | 4555/2S end, deep spot | oligotrophic | 5.59 | 24to 2025 | 4.3 m136 readings | 3 of 5 |
| Redstone LakeHaliburton County | 4596/2Opp Picadilly Bay | oligotrophic | 4.34 | 18to 2021 | 5.4 m79 readings | 2 of 5 |
| Salerno LakeHaliburton County | 4756/2S end, deep spot | mesotrophic | 10.44 | 14to 2025 | 5.4 m112 readings | 2 of 2 |
| South LakeHaliburton County | 5066/1Mid Lake, deep spot | oligotrophic | 7.21 | 21to 2025 | 4.1 m266 readings | 1 of 1 |
| Soyers LakeHaliburton County | 5090/1Mid Lake, deep spot | oligotrophic | 7.34 | 18to 2025 | 4.5 m180 readings | 1 of 2 |
| St. Nora LakeHaliburton County | 5146/1Mid Lake, deep spot | oligotrophic | 4.37 | 3to 2016 | no readings | 1 of 1 |
| Twelve Mile LakeHaliburton County | 5493/2Main Basin, deep spot | oligotrophic | 5.9 | 10to 2019 | 5.5 m114 readings | 2 of 4 |
Head Lake (Haliburton County) and Sherborne Lake have registered sites with fewer than three years of phosphorus readings.
Parry Sound Lake Water Quality
Lake Partner sites with a status lie on 23 of the 25 Parry Sound lakes below. In all, 84 sites hold one: 65 oligotrophic, eighteen mesotrophic and one eutrophic.
| Lake | Site | Band | Phosphorus, µg/L | Years sampled | Median Secchi | Sites with a status |
|---|---|---|---|---|---|---|
| Ahmic LakeParry Sound District | 32/1Pickerel Pt. | mesotrophic | 10.13 | 23to 2025 | 2.7 m170 readings | 5 of 5 |
| Bay LakeParry Sound District | 258/1W end, deep spot | oligotrophic | 6.25 | 23to 2025 | 4.7 m269 readings | 3 of 3 |
| Bear LakeParry Sound District | 268/1Mid Lake, deep spot | oligotrophic | 9.96 | 19to 2025 | 2.5 m26 readings | 1 of 1 |
| Lake BernardParry Sound District | 337/1Main Basin-deep spot | oligotrophic | 6.72 | 19to 2024 | 4.2 m107 readings | 5 of 8 |
| Blackstone LakeParry Sound District | 461/1Mid Lake, deep spot | oligotrophic | 7.68 | 19to 2025 | 4.5 m113 readings | 1 of 9 |
| Lake CecebeParry Sound District | 795/3Lighthouse Basin | mesotrophic | 12.44 | 15to 2019 | 2.7 m3 readings | 3 of 5 |
| Clear LakeParry Sound District | 899/1Mid Lake, deep spot | oligotrophic | 7.9 | 23to 2025 | 5.5 m249 readings | 1 of 2 |
| Clear LakeParry Sound District | 888/1Central Basin | oligotrophic | 6.88 | 20to 2025 | 7.3 m75 readings | 3 of 5 |
| Crane LakeParry Sound District | 1014/2N end, Off Marsh Is. | oligotrophic | 4.98 | 18to 2025 | 4.6 m84 readings | 2 of 11 |
| Eagle LakeParry Sound District | 1298/2Stn 2, N end | oligotrophic | 8.45 | 22to 2025 | 4.0 m173 readings | 2 of 2 |
| Harris LakeParry Sound District | 1875/1Eastern Bay | oligotrophic | 8.91 | 21to 2025 | 3.3 m73 readings | 1 of 1 |
| Healey LakeParry Sound District | 1924/13Pinebay, Deep Spot | oligotrophic | 7.58 | 8to 2025 | 2.7 m17 readings | 3 of 16 |
| Horseshoe LakeParry Sound District | 2026/1Stn 1, Christie Bay | oligotrophic | 7.68 | 22to 2025 | 3.0 m166 readings | 5 of 11 |
| Little Lake JosephParry Sound District | 2660/1Main Basin-deep spot | oligotrophic | 5.65 | 8to 2013 | 5.5 m83 readings | 3 of 4 |
| Manitouwabing LakeParry Sound District | 2973/8West of Maplewood | mesotrophic | 14.54 | 23to 2025 | 2.4 m241 readings | 11 of 17 |
| Otter LakeParry Sound District | 4193/1OT01 | oligotrophic | 5.79 | 16to 2018 | 5.9 m128 readings | 6 of 9 |
| Rankin LakeParry Sound District | 4545/3Stn 1, Nina Island | oligotrophic | 8.45 | 19to 2025 | 4.7 m180 readings | 3 of 6 |
| Restoule LakeParry Sound District | 4609/4RE02 | oligotrophic | 8.9 | 4to 2025 | 2.6 m2 readings | 2 of 4 |
| Sand LakeParry Sound District | 4776/1Deep spot | oligotrophic | 6.64 | 22to 2025 | 4.5 m232 readings | 1 of 2 |
| Star LakeParry Sound District | 5155/4Mid lake, deep spot | mesotrophic | 10.64 | 10to 2025 | 1.8 m6 readings | 2 of 4 |
| Three Mile LakeParry Sound District | 7129/2Mid lk-deepst Watson | mesotrophic | 10.63 | 15to 2025 | 3.5 m48 readings | 2 of 3 |
| Wahwashkesh LakeParry Sound District | 5701/9off E Birch Is | oligotrophic | 6.67 | 21to 2025 | 3.2 m162 readings | 17 of 23 |
| Whitefish LakeParry Sound District | 5857/8Mid Lake, Deep spot | oligotrophic | 4.55 | 12to 2025 | 5.3 m91 readings | 2 of 8 |
Doe Lake and Pickerel Lake have registered sites with fewer than three years of phosphorus readings.
Kawartha Lakes and Peterborough Water Quality
Lake Partner sites with a status lie on 34 of the 37 Kawartha and Peterborough lakes below. In all, 108 sites hold one: 34 oligotrophic, 64 mesotrophic and ten eutrophic.
| Lake | Site | Band | Phosphorus, µg/L | Years sampled | Median Secchi | Sites with a status |
|---|---|---|---|---|---|---|
| Anstruther LakePeterborough County | 96/2S end, deep spot | oligotrophic | 5.79 | 19to 2025 | 5.0 m163 readings | 2 of 5 |
| Balsam LakeKawartha Lakes | 6902/2N Bay Rocky Pt. | mesotrophic | 10.54 | 24to 2025 | 5.3 m177 readings | 7 of 8 |
| Beaver LakePeterborough County | 7040/2Mid lake, deep spot | mesotrophic | 11.26 | 14to 2025 | 3.2 m9 readings | 2 of 3 |
| Belmont LakePeterborough County | 6939/2Crowe R. Inlet | oligotrophic | 7.46 | 10to 2011 | 5.0 m140 readings | 2 of 4 |
| Big Bald LakePeterborough County | 6941/1Mid Lake, deep spot | mesotrophic | 11.78 | 22to 2025 | 3.7 m157 readings | 2 of 2 |
| Big Cedar LakePeterborough County | 363/1Mid Lake, deep spot | oligotrophic | 6.2 | 22to 2025 | 5.2 m292 readings | 1 of 1 |
| Buckhorn LakePeterborough County | 7131/1Narrows-redbuoy C310 | mesotrophic | 17.14 | 19to 2022 | 3.0 m113 readings | 4 of 10 |
| Cameron LakeKawartha Lakes | 6905/6S end, deep spot | mesotrophic | 11.11 | 9to 2025 | 3.2 m25 readings | 3 of 6 |
| Canal LakeKawartha Lakes | 7047/1Main Basin-deep spot | mesotrophic | 17.94 | 24to 2025 | 2.0 m119 readings | 1 of 1 |
| Catchacoma LakePeterborough County | 782/3N end-S of Geale Is. | oligotrophic | 5.2 | 21to 2025 | 3.3 m150 readings | 3 of 7 |
| Chandos LakePeterborough County | 815/1W Bay, deep spot | oligotrophic | 8.37 | 22to 2025 | 4.5 m150 readings | 7 of 11 |
| Chemong LakePeterborough County | 6951/9S. of Causeway | mesotrophic | 16.54 | 14to 2023 | 2.9 m50 readings | 5 of 7 |
| Clear LakePeterborough County | 6955/2Main Basin-deep spot | mesotrophic | 15.24 | 23to 2025 | 4.0 m136 readings | 5 of 5 |
| Cordova LakePeterborough County | 6957/2S end, dam | oligotrophic | 9.09 | 21to 2025 | 4.65 m178 readings | 2 of 4 |
| Crowe LakePeterborough and Hastings County | 6959/1Deep spot | oligotrophic | 8.68 | 18to 2023 | 4.55 m114 readings | 2 of 2 |
| Crystal LakeKawartha Lakes | 1063/2Mid Lake, deep spot | mesotrophic | 10.26 | 13to 2014 | 5.0 m185 readings | 6 of 8 |
| Dalrymple LakeSimcoe County and Kawartha Lakes | 1095/2Upper-Campbells Beach | mesotrophic | 15.13 | 7to 2025 | 2.0 m53 readings | 3 of 3 |
| Eels LakePeterborough and Haliburton County | 1340/2S end, deep spot | oligotrophic | 5.71 | 22to 2025 | 5.1 m170 readings | 1 of 6 |
| Four Mile LakeKawartha Lakes | 1543/1S end, Mid Lake | oligotrophic | 6.15 | 22to 2025 | 6.5 m127 readings | 1 of 1 |
| Head LakeKawartha Lakes | 1917/3Mid Lake, deep spot | mesotrophic | 11.39 | 16to 2025 | 3.4 m59 readings | 2 of 2 |
| Jack LakePeterborough County | 2118/3Brook's Bay-Snake Is | oligotrophic | 9.81 | 24to 2025 | 4.05 m170 readings | 2 of 7 |
| Kasshabog LakePeterborough County | 2242/1Big Lake | oligotrophic | 5.73 | 19to 2025 | 5.0 m188 readings | 3 of 3 |
| Lovesick LakePeterborough County | 7087/180' hole at N. end | mesotrophic | 17.17 | 23to 2025 | 4.5 m127 readings | 3 of 3 |
| Lower Buckhorn LakePeterborough County | 6990/1Heron Island | mesotrophic | 16.94 | 22to 2024 | 3.6 m103 readings | 5 of 7 |
| Mississagua LakePeterborough County | 3266/1Mid Lake, deep spot | oligotrophic | 4.72 | 4to 2015 | 4.5 m17 readings | 4 of 5 |
| Mitchell LakeKawartha Lakes | 7095/2Mid Lake, deep spot | eutrophic | 22.38 | 9to 2025 | 1.9 m34 readings | 2 of 2 |
| Pigeon LakeKawartha Lakes and Peterborough County | 6919/12N-400m N of Boyd Is. | mesotrophic | 15.95 | 23to 2025 | 3.4 m94 readings | 6 of 11 |
| Rice LakeNorthumberland and Peterborough County | 6920/34Stn 34 Spook Is. | eutrophic | 23.42 | 4to 2008 | 1.5 m14 readings | 1 of 6 |
| Round LakePeterborough County | 7009/1Mid Lake, deep spot | oligotrophic | 7.84 | 22to 2025 | 4.0 m105 readings | 2 of 2 |
| Sandy LakePeterborough County | 7241/2Mid Lake, deep spot | oligotrophic | 6.77 | 18to 2021 | 4.7 m97 readings | 1 of 1 |
| Lake ScugogDurham Region | 6922/12Viewlake-deep spot | eutrophic | 22.55 | 16to 2025 | 0.9 m93 readings | 6 of 10 |
| Stony LakePeterborough County | 7133/7Mouse Is. | mesotrophic | 13.32 | 23to 2025 | 4.2 m153 readings | 4 of 5 |
| Sturgeon LakeKawartha Lakes | 6924/4Muskrat I-Buoy C388 | mesotrophic | 17.04 | 22to 2025 | 3.2 m103 readings | 7 of 9 |
| White LakePeterborough County | 6963/1S end, deep spot | mesotrophic | 12.54 | 24to 2025 | 4.4 m196 readings | 1 of 1 |
Gold Lake and Shadow Lake have registered sites with fewer than three years of phosphorus readings. No Lake Partner site is registered on Little Bald Lake.
Simcoe County and Southern Ontario
Lake Partner sites with a status lie on nine of the thirteen Simcoe County and southern Ontario lakes below. In all, seventeen sites hold one: seven oligotrophic, five mesotrophic and five eutrophic.
| Lake | Site | Band | Phosphorus, µg/L | Years sampled | Median Secchi | Sites with a status |
|---|---|---|---|---|---|---|
| Bass LakeSimcoe County | 6935/2Mid Lake, deep spot | mesotrophic | 11.28 | 13to 2018 | 3.0 m78 readings | 1 of 2 |
| Lake BelwoodWellington County | 7581/1Mid north/west end | eutrophic | 26.36 | 6to 2019 | 1.3 m69 readings | 1 of 1 |
| Chesley LakeBruce County | 6865/1Mid Lake, deep spot | mesotrophic | 14.69 | 8to 2025 | 3.0 m58 readings | 1 of 1 |
| Lake CouchichingSimcoe County | 2454/3S end, deep spot | oligotrophic | 9.39 | 13to 2020 | 4.5 m53 readings | 4 of 4 |
| Lake EugeniaGrey County | 6853/1Main basin, deep spot, W side | oligotrophic | 8.25 | 12to 2025 | 3.4 m48 readings | 2 of 2 |
| Farlain LakeSimcoe County | 6967/4Mid Lake, deep spot | oligotrophic | 9.63 | 19to 2025 | 3.0 m55 readings | 1 of 3 |
| Miller LakeBruce County | 6870/1Mid Lake, deep spot | oligotrophic | 9.6 | 14to 2025 | 1.9 m38 readings | 1 of 1 |
| Lake SimcoeSimcoe County, York and Durham | 6982/3Cedarmont Beach | mesotrophic | 12.3 | 23to 2024 | 4.0 m169 readings | 2 of 7 |
| Lake St. JohnSimcoe County | 5141/1Main Basin-deep spot | eutrophic | 38.66 | 10to 2025 | 2.5 m78 readings | 4 of 4 |
MacLean Lake, Puslinch Lake and Tea Lake have registered sites with fewer than three years of phosphorus readings. No Lake Partner site is registered on Conestogo Lake.
Eastern Ontario Lake Water Quality
Lake Partner sites with a status lie on 44 of the 50 eastern Ontario lakes below. In all, 164 sites hold one: 96 oligotrophic, 55 mesotrophic and thirteen eutrophic.
| Lake | Site | Band | Phosphorus, µg/L | Years sampled | Median Secchi | Sites with a status |
|---|---|---|---|---|---|---|
| Aylen LakeRenfrew County | 160/1Mid Lake, deep spot | oligotrophic | 4.13 | 10to 2025 | 5.5 m54 readings | 1 of 4 |
| Baptiste LakeHastings County | 196/2Lavallee Bay | mesotrophic | 15.52 | 21to 2025 | 4.0 m184 readings | 2 of 5 |
| Big Gull LakeFrontenac County | 373/3Pinnacle Point | oligotrophic | 8.92 | 24to 2025 | 4.3 m232 readings | 4 of 5 |
| Big Rideau LakeLeeds and Grenville | 4624/4Tower Island-BRLA13 | oligotrophic | 9.03 | 11to 2016 | 6.5 m18 readings | 10 of 18 |
| Black Donald LakeRenfrew County | 6943/3Back Bay | oligotrophic | 8.04 | 7to 2008 | 4.0 m107 readings | 1 of 3 |
| Bobs LakeFrontenac County | 510/10Norris Bay | oligotrophic | 9.48 | 24to 2025 | 4.8 m208 readings | 19 of 24 |
| Buckshot LakeLennox and Addington County | 625/1Mouth of E Bay | oligotrophic | 5.83 | 17to 2025 | 5.2 m273 readings | 2 of 3 |
| Calabogie LakeRenfrew County | 691/6South West, deep spot | oligotrophic | 8.35 | 10to 2024 | 3.5 m46 readings | 5 of 7 |
| Charleston LakeLeeds and Grenville | 822/1Big Water | mesotrophic | 10.13 | 23to 2025 | 6.0 m140 readings | 7 of 11 |
| Christie LakeLanark County | 6952/3North Shore, deep spot | oligotrophic | 9.18 | 5to 2016 | 6.1 m2 readings | 2 of 3 |
| Lake ClearRenfrew County | 2453/1E. end, centre | oligotrophic | 8.62 | 22to 2025 | 7.3 m108 readings | 5 of 6 |
| Crow LakeFrontenac County | 6240/1Mid Lake, deep spot | oligotrophic | 8.91 | 21to 2025 | 5.2 m210 readings | 3 of 4 |
| Desert LakeFrontenac County | 6266/1S end, deep spot | mesotrophic | 10.5 | 18to 2021 | 5.5 m195 readings | 3 of 8 |
| Devil LakeFrontenac County | 1170/2South of Buce Bay,E endBuceBay | oligotrophic | 7.59 | 21to 2025 | 6.6 m168 readings | 8 of 8 |
| Dog LakeFrontenac County | 1217/1N end-St. Helena Is. | eutrophic | 21.67 | 24to 2025 | 3.0 m93 readings | 7 of 7 |
| Lake DoréRenfrew County | 2456/1Mid lake, deep spot | mesotrophic | 11.48 | 9to 2025 | 4.6 m35 readings | 1 of 1 |
| Eagle LakeFrontenac County | 6285/1N/W end, deep spot | oligotrophic | 9.5 | 21to 2025 | 5.4 m212 readings | 3 of 5 |
| Golden LakeRenfrew County | 1675/3Mid Lake, deep spot | oligotrophic | 8.93 | 9to 2024 | 3.5 m30 readings | 2 of 4 |
| Kamaniskeg LakeRenfrew County | 2223/6North Basin | oligotrophic | 6.55 | 16to 2025 | 4.5 m85 readings | 6 of 8 |
| Kashwakamak LakeFrontenac County | 2240/3W end, Main Chan, deep spot | oligotrophic | 6.44 | 23to 2025 | 5.0 m213 readings | 2 of 2 |
| Kennebec LakeFrontenac County | 6977/3W end-Salmon R Mouth | mesotrophic | 10.17 | 24to 2025 | 2.6 m116 readings | 2 of 2 |
| Loughborough LakeFrontenac County | 6512/2E-1.8km East of Bridge | mesotrophic | 14.41 | 20to 2022 | 4.0 m103 readings | 6 of 7 |
| Mink LakeRenfrew County | 3238/2Mid Lake, deep spot | oligotrophic | 7.31 | 13to 2016 | 3.4 m7 readings | 2 of 2 |
| Mississippi LakeLanark County | 6996/4E end, Channel | mesotrophic | 11.01 | 13to 2018 | 3.3 m13 readings | 3 of 4 |
| Moira LakeHastings County | 6997/1E Basin, Watson Cove | eutrophic | 21.49 | 7to 2008 | 2.7 m79 readings | 3 of 5 |
| Muskrat LakeRenfrew County | 3401/2S end Near Cobden | eutrophic | 31.63 | 5to 2010 | 1.5 m22 readings | 3 of 6 |
| Newboro LakeLeeds and Grenville | 3458/1Hungry Bay | mesotrophic | 12.31 | 23to 2025 | 4.85 m236 readings | 2 of 4 |
| Otter LakeLeeds and Grenville | 4187/1Mid Lake, deep spot | mesotrophic | 10.39 | 16to 2025 | 4.9 m37 readings | 3 of 4 |
| Palmerston LakeFrontenac County | 4230/3Central Basin | oligotrophic | 5.42 | 5to 2025 | 6.5 m5 readings | 1 of 6 |
| Papineau LakeHastings County | 4239/3Main basin, deep spot | oligotrophic | 4.53 | 11to 2025 | 5.4 m15 readings | 1 of 5 |
| Red Horse LakeLeeds and Grenville | 4575/1W Basin-S Centre Is. | mesotrophic | 16.7 | 14to 2015 | 4.0 m151 readings | 1 of 7 |
| Round LakeRenfrew County | 4713/1N end, Mid-lake | oligotrophic | 6.94 | 20to 2025 | 3.6 m87 readings | 1 of 3 |
| Sand LakeLeeds and Grenville | 7011/1Mid Lake, deep spot | mesotrophic | 13.31 | 24to 2025 | 5.0 m674 readings | 1 of 1 |
| Sharbot LakeFrontenac County | 4903/5W Basin Prov. Pk | oligotrophic | 9.5 | 19to 2024 | 5.4 m155 readings | 4 of 7 |
| Silver LakeLanark County | 4950/1Mid Lake, deep spot | oligotrophic | 6.24 | 18to 2025 | 6.35 m102 readings | 2 of 2 |
| Skootamatta LakeLennox and Addington County | 4986/4Lower Basin-DeepSpot | oligotrophic | 8.69 | 18to 2025 | 4.2 m32 readings | 6 of 6 |
| Lake St. PeterHastings County | 5147/1Mid Lake, deep spot | oligotrophic | 7.29 | 10to 2025 | 2.8 m59 readings | 1 of 3 |
| Steenburg LakeHastings County | 5163/2Mid Lake, deep spot | oligotrophic | 8.8 | 21to 2024 | 4.7 m47 readings | 1 of 2 |
| Sydenham LakeFrontenac County | 5284/1Eel Bay, deep spot | mesotrophic | 12.44 | 11to 2025 | 4.0 m19 readings | 3 of 3 |
| Upper Beverley LakeLeeds and Grenville | 7027/1Outlet | mesotrophic | 18.71 | 10to 2011 | 2.7 m75 readings | 2 of 4 |
| Weslemkoon LakeHastings County | 5795/4Main Basin-deep spot | oligotrophic | 6.12 | 4to 2008 | 5.0 m3 readings | 7 of 13 |
| White LakeLanark County | 5841/2Three Mile Bay | mesotrophic | 18.33 | 12to 2015 | 2.7 m120 readings | 10 of 11 |
| Whitefish LakeLeeds and Grenville | 6632/1S end, deep spot | mesotrophic | 13.49 | 21to 2025 | 3.6 m93 readings | 4 of 4 |
| Wollaston LakeHastings County | 6819/1Mid Lake, deep spot | oligotrophic | 7.27 | 22to 2024 | 5.0 m188 readings | 2 of 3 |
Bark Lake, Centennial Lake, Crotch Lake and Dalhousie Lake have registered sites with fewer than three years of phosphorus readings. No Lake Partner site is registered on Constant Lake or Varty Lake.
Nipissing, Sudbury and Northeastern Ontario
Lake Partner sites with a status lie on 38 of the 48 northeastern Ontario lakes below. In all, 241 sites hold one: 162 oligotrophic, 63 mesotrophic and sixteen eutrophic.
| Lake | Site | Band | Phosphorus, µg/L | Years sampled | Median Secchi | Sites with a status |
|---|---|---|---|---|---|---|
| Agnew LakeSudbury District | 6051/1Espanola Bay | oligotrophic | 6.37 | 3to 2007 | 3.8 m1 reading | 1 of 9 |
| Basswood LakeAlgoma District | 246/1East basin, deep spot | oligotrophic | 2.81 | 18to 2025 | 11.5 m146 readings | 2 of 2 |
| Cassels LakeNipissing District | 774/8Deep Spot | oligotrophic | 6.11 | 12to 2025 | no readings | 4 of 11 |
| Chiblow LakeAlgoma District | 841/2S basin | oligotrophic | 3.82 | 4to 2017 | 5.5 m1 reading | 2 of 3 |
| Fairbank LakeSudbury District | 1417/2Stn 2, E Mid-lake | oligotrophic | 5.27 | 24to 2025 | 7.3 m200 readings | 6 of 8 |
| Frederick House LakeCochrane District | 1574/1N57, M75 Barbers Bay N | eutrophic | 20.94 | 5to 2010 | 1.75 m2 readings | 3 of 10 |
| Lake KagawongManitoulin District | 6888/1North East Harbour | oligotrophic | 8.3 | 4to 2025 | 6.7 m17 readings | 3 of 6 |
| Kenogami LakeTimiskaming District | 2295/1N end, deep spot | mesotrophic | 15.13 | 7to 2024 | 1.5 m3 readings | 5 of 7 |
| Kukagami LakeSudbury District | 2369/1Deep spot | oligotrophic | 5.15 | 19to 2025 | 7.1 m90 readings | 2 of 7 |
| Larder LakeTimiskaming District | 6457/1N30,Main Basin, deep spot | oligotrophic | 8.76 | 8to 2024 | 2.1 m3 readings | 4 of 5 |
| Lauzon LakeAlgoma District | 2506/10E basin – Snucins 5 | oligotrophic | 4.36 | 5to 2019 | 4.75 m2 readings | 11 of 11 |
| Long LakeSudbury District | 2784/8NE End, deep spot | oligotrophic | 8.55 | 13to 2025 | 4.0 m157 readings | 9 of 13 |
| Lake ManitouManitoulin District | 6451/2Stn 2, W-Moody Bay | oligotrophic | 8.01 | 23to 2025 | 6.0 m167 readings | 3 of 12 |
| Matinenda LakeAlgoma District | 3051/3Bakers Bay-deep spot | oligotrophic | 4.75 | 15to 2025 | 7.2 m85 readings | 5 of 12 |
| Mindemoya LakeManitoulin District | 6885/1deep spot | oligotrophic | 6.67 | 3to 2025 | 5.1 m16 readings | 1 of 3 |
| Nepahwin LakeSudbury District | 6053/7Sudbury – deep spot, NEP-1 | eutrophic | 20.46 | 11to 2025 | 2.5 m1 reading | 7 of 10 |
| Nepewassi LakeSudbury District | 3449/3Mine Bay, deep spot | mesotrophic | 13.21 | 10to 2025 | 2.0 m50 readings | 4 of 5 |
| Net LakeNipissing District | 3451/1NT-1 North Arm, N NL-1 | oligotrophic | 5.8 | 6to 2025 | no readings | 6 of 6 |
| Lake NipissingNipissing District | 2467/10Centre Callander Bay | mesotrophic | 19.37 | 17to 2025 | 1.75 m42 readings | 22 of 29 |
| Lake NosbonsingNipissing District | 4098/6Astorville Bay,TEF1 | eutrophic | 20.52 | 17to 2025 | 1.75 m6 readings | 15 of 30 |
| Onaping LakeSudbury District | 4156/2Big Water | oligotrophic | 7.62 | 5to 2025 | 3.6 m39 readings | 2 of 5 |
| Lake PanacheSudbury District | 4234/6Stn 1, Stoney Bay | oligotrophic | 5.71 | 17to 2025 | 5.0 m55 readings | 9 of 17 |
| Porcupine LakeCochrane District | 7338/1N end, near college | mesotrophic | 18.81 | 10to 2024 | 1.9 m2 readings | 2 of 2 |
| Rabbit LakeNipissing District | 4497/7Deep spot,Teacher's Bay 40' | oligotrophic | 5.57 | 12to 2025 | 4.9 m75 readings | 7 of 13 |
| Ramsey LakeSudbury District | 4534/4City of Sudbury 4 E | mesotrophic | 10.12 | 13to 2025 | 3.0 m1 reading | 4 of 6 |
| Remi LakeCochrane District | 4604/3N92, M96, NE end | mesotrophic | 11.57 | 7to 2024 | 2.8 m2 readings | 2 of 2 |
| Richard LakeSudbury District | 4621/4Sudbury-Mid Lake RIC-3 | oligotrophic | 7.94 | 13to 2025 | no readings | 2 of 4 |
| Sesekinika LakeTimiskaming District | 4875/7Mid lake, deep spot | mesotrophic | 15.74 | 9to 2025 | 1.2 m5 readings | 6 of 10 |
| Lake TalonNipissing District | 6454/4Stn1-Kaibuskong Bay | mesotrophic | 18.37 | 14to 2025 | 2.8 m94 readings | 3 of 18 |
| Lake TemagamiNipissing District | 2477/2S/W Arm, deep spot | oligotrophic | 4.56 | 22to 2025 | 6.75 m180 readings | 33 of 47 |
| Trout LakeNipissing District | 5455/1Delaney Bay, TL1 | oligotrophic | 3.97 | 13to 2025 | 5.4 m53 readings | 18 of 19 |
| Trout LakeSudbury District | 5454/11Ranger Bay | oligotrophic | 6.52 | 18to 2025 | 3.8 m52 readings | 8 of 13 |
| Turtle LakeNipissing District | 6761/3Turtle Lake- STN-1 | oligotrophic | 5.4 | 3to 2019 | 3.5 m2 readings | 2 of 6 |
| Vermilion LakeSudbury District | 5657/3North part of bay, CGS VER-3 | oligotrophic | 9.63 | 7to 2017 | no readings | 2 of 5 |
| Wanapitei LakeSudbury District | 5727/5Kolari Bay, Deep Spot | oligotrophic | 6.08 | 10to 2025 | 4.7 m58 readings | 8 of 8 |
| Watabeag LakeTimiskaming District | 5747/1N76, N end | mesotrophic | 10.0 | 4to 2018 | 2.2 m2 readings | 5 of 11 |
| Windy LakeSudbury District | 5924/7SE Arm – Sudbury MOE WL4 | oligotrophic | 4.12 | 11to 2025 | 6.65 m6 readings | 5 of 8 |
| Lake WolseyManitoulin District | 6883/4Sein-SP4, S-central Reference | oligotrophic | 7.6 | 5to 2018 | no readings | 8 of 13 |
Canoe Lake, Long Lake (Timiskaming District), Night Hawk Lake and Ranger Lake have registered sites with fewer than three years of phosphorus readings. No Lake Partner site is registered on Lady Evelyn Lake, Missinaibi Lake, Mistinikon Lake, Obabika Lake, Lake Opeongo or Red Cedar Lake.
Northwestern Ontario Lake Water Quality
Lake Partner sites with a status lie on eighteen of the 32 northwestern Ontario lakes below. In all, 113 sites hold one: seventeen oligotrophic, 65 mesotrophic and 31 eutrophic.
| Lake | Site | Band | Phosphorus, µg/L | Years sampled | Median Secchi | Sites with a status |
|---|---|---|---|---|---|---|
| Black Sturgeon LakesKenora District | 450/6UpperLk-EagleViewBay | mesotrophic | 14.49 | 22to 2025 | 2.3 m236 readings | 10 of 16 |
| Eagle LakeKenora District | 1299/4Waldhof Bay, deep spot | mesotrophic | 11.1 | 6to 2024 | 2.55 m4 readings | 4 of 4 |
| Eva LakeRainy River District | 1407/1east | oligotrophic | 7.7 | 4to 2025 | 3.0 m1 reading | 2 of 3 |
| Hawkeye LakeThunder Bay District | 1907/1SW end, deep spot | oligotrophic | 7.63 | 10to 2022 | 2.8 m4 readings | 3 of 3 |
| Kakagi LakeKenora District | 2218/2Mid lake, deep spot | oligotrophic | 5.47 | 3to 2018 | no readings | 1 of 2 |
| Lake of the WoodsKenora District | 2473/12ClearWB-Mud Portage | mesotrophic | 15.83 | 24to 2025 | 3.0 m278 readings | 55 of 139 |
| Longpine LakeKenora District | 7154/1Main Basin-deep spot | mesotrophic | 11.64 | 19to 2025 | 2.5 m136 readings | 4 of 4 |
| Lower Shebandowan LakeThunder Bay District | 6675/1Lower-Cache Is, E | mesotrophic | 11.67 | 23to 2025 | 2.4 m98 readings | 3 of 4 |
| Lake LuluKenora District | 7148/1Webb's Rd- W Laclu | mesotrophic | 18.54 | 23to 2025 | 2.55 m186 readings | 5 of 8 |
| Malachi LakeKenora District | 2959/1Copeland's Bay | mesotrophic | 18.95 | 21to 2025 | 3.3 m298 readings | 6 of 8 |
| Middle Shebandowan LakeThunder Bay District | 3205/1Rossmere Bay, Mid-lake | oligotrophic | 9.44 | 23to 2025 | 3.3 m109 readings | 3 of 3 |
| Lac des Mille LacsThunder Bay District | 2391/2Sawbill bay | eutrophic | 23.7 | 3to 2024 | 0.6 m3 readings | 4 of 6 |
| Thunder LakeKenora District | 5370/1TDR-1 Outflow at dam | mesotrophic | 13.77 | 4to 2022 | no readings | 2 of 3 |
| Upper Shebandowan LakeThunder Bay District | 5637/1Upper Basin-E-End, 3 mile bay | oligotrophic | 8.31 | 24to 2025 | 2.8 m145 readings | 2 of 3 |
| Wabaskang LakeKenora District | 6787/1North basin, Deep Spot Wab-N | mesotrophic | 12.94 | 9to 2023 | 3.5 m5 readings | 4 of 4 |
| Wabigoon LakeKenora District | 5689/3Pronger's Pt. | eutrophic | 23.32 | 4to 2024 | 1.5 m1 reading | 2 of 3 |
| White LakeThunder Bay District | 5843/1Mid Lake, deep spot | oligotrophic | 9.75 | 22to 2025 | 3.4 m234 readings | 1 of 1 |
| Whitefish LakeThunder Bay District | 5861/1W end | mesotrophic | 11.22 | 6to 2018 | 3.85 m2 readings | 2 of 4 |
Abram Lake, Dryberry Lake, Pelican Lake, Red Lake and White Otter Lake have registered sites with fewer than three years of phosphorus readings. No Lake Partner site is registered on Dinorwic Lake, Dog Lake (Thunder Bay District), Kenogamisis Lake, Marmion Lake, Minnitaki Lake, Lake Nipigon, Lac Seul, Sturgeon Lake (Thunder Bay District) or Wildgoose Lake.
Lake Simcoe Water Quality
Lake Simcoe is measured by the province itself. The Ministry of the Environment, Conservation and Parks samples eight lake stations about every two weeks from spring to fall, and has published the record from 1980 as open data.
The province’s Lake Simcoe 15-Year Monitoring Report, published in December 2025 and covering the record to 2022, records that phosphorus in the ice-free season has fallen significantly at all eight lake stations since the 1980s, and that clarity has risen at every station since 1980, appearing to level off or decline in recent years. Chloride has risen at all eight stations.
At station K42, Kempenfelt Bay 42, the Secchi disk disappeared at an average 4.3 meters in 1980 to 1984, at 7.6 meters in 2015 to 2019, and at 6.5 meters in 2020 to 2024. Over 2015 to 2024, ice-free phosphorus averaged 7.8 µg/L at station K45 and 14.1 µg/L at station C1, Cooks Bay 1, the shallowest of the eight.
| Station | Secchi, first block | Secchi, latest block | Phosphorus, µg/L, 2015 to 2024 |
|---|---|---|---|
| K39Kempenfelt Bay 39 | 4.2 m1980 to 1984 | 6.3 m2020 to 2024 | 8.59 years, 107 samples |
| K42Kempenfelt Bay 42 | 4.3 m1980 to 1984 | 6.5 m2020 to 2024 | 8.110 years, 112 samples |
| K45Kempenfelt Bay 45 | 4.3 m1980 to 1984 | 6.8 m2020 to 2024 | 7.810 years, 111 samples |
| S15S15 | 4.5 m1985 to 1989 | 6.8 m2020 to 2024 | 8.010 years, 111 samples |
| E51E51 | 3.6 m1980 to 1984 | 6.9 m2020 to 2024 | 8.510 years, 109 samples |
| C9Cooks Bay 9 | 3.5 m1980 to 1984 | 5.4 m2020 to 2024 | 9.910 years, 114 samples |
| C6Cooks Bay 6 | 2.8 m1980 to 1984 | 4.4 m2020 to 2024 | 12.19 years, 108 samples |
| C1Cooks Bay 1 | 1.6 m1980 to 1984 | 2.4 m2020 to 2024 | 14.19 years, 107 samples |
Mussels, Algae and Blooms on Lake Simcoe
The same report records zebra mussels establishing in the lake in the mid-1990s and quagga mussels spreading through its nearshore and deep water from 2010. Quagga mussels now cover the whole bottom of the lake and feed at cooler temperatures than zebra mussels, which held only the nearshore bottom. Both filter phytoplankton and phosphorus-bearing particles from the water, and the province links them to the clearer water and to a change in how phosphorus cycles through the lake. Starry stonewort, an invasive macroalga, appears to have replaced Eurasian watermilfoil among the lake’s most abundant plants since 2018.
Blue-green algal blooms confirmed on Lake Simcoe from 2018 to 2022 were confined to small, localized areas. A larger bloom was observed in several parts of the lake in 2024, and its toxin measurements were very low or below detection.
The Lake Partner Program has seven registered sites on Lake Simcoe, and two hold a status: site 6982/3, Cedarmont Beach, averaging 12.3 µg/L over 23 years to 2024 and site 6982/7, Strawberry Island, averaging 11.58 µg/L over eight years to 2009.
Blue-Green Algae in Ontario Lakes
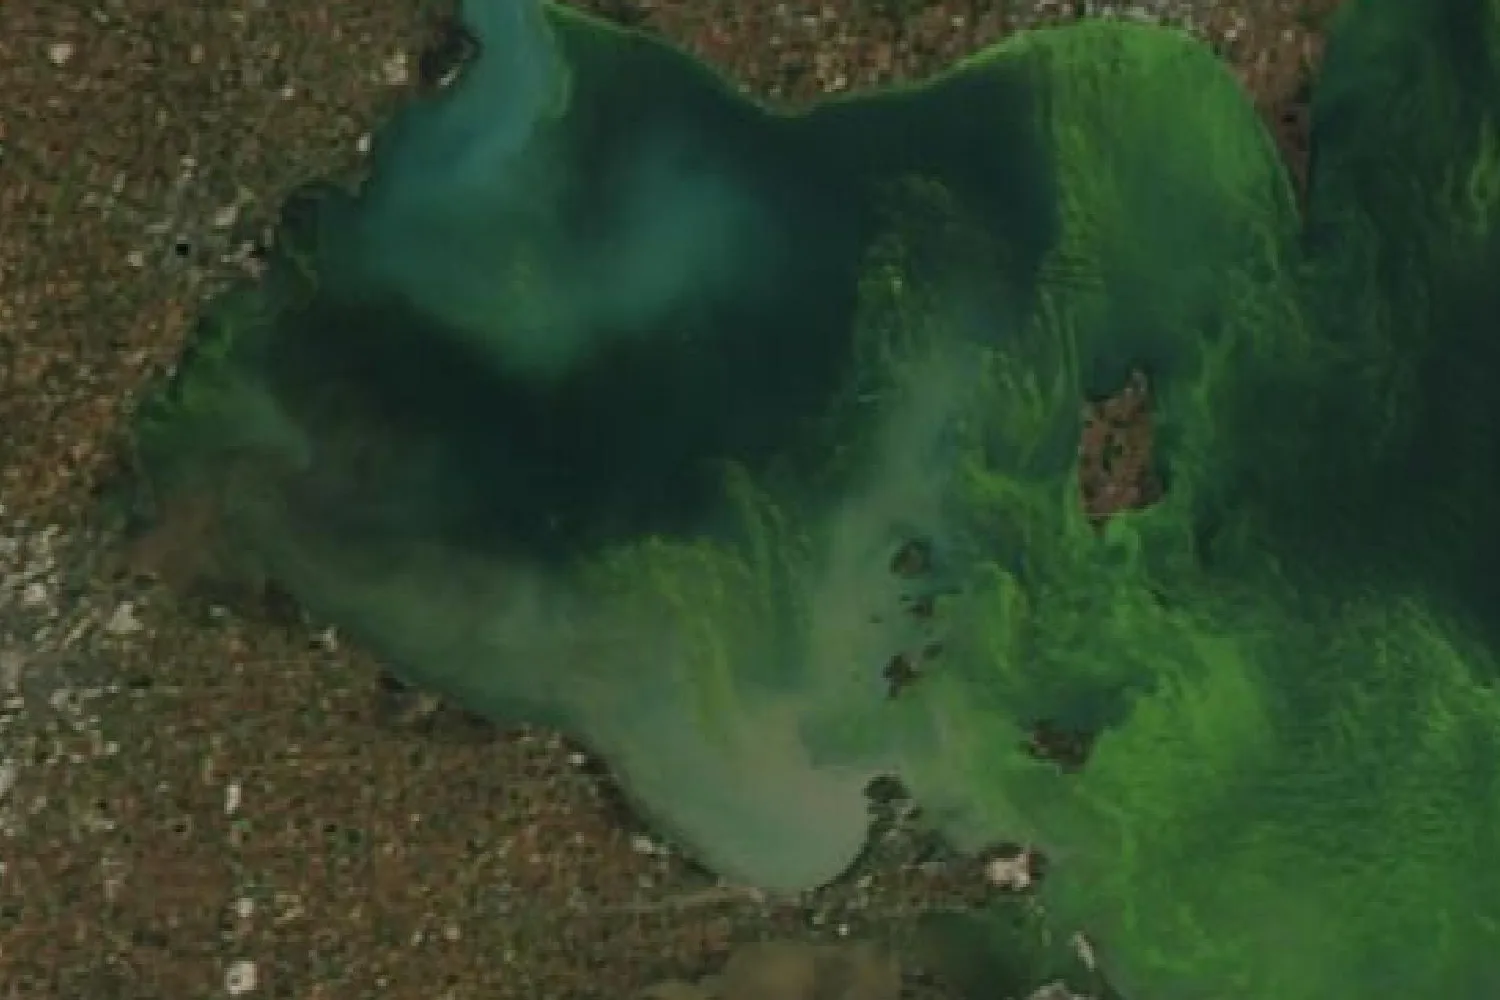
Blue-green algae, more correctly called cyanobacteria, are microscopic organisms that occur naturally in lakes, ponds, rivers and streams. When their numbers rise quickly they form a bloom, a dense mass or scum in the water. Some kinds produce toxins, called cyanotoxins, which are harmful to people and animals.
When Blooms Occur
In Ontario, blooms are most common in late summer and early fall, and they occur in other seasons as well. Shallow, slow-moving, warm water suits the organisms best. A bloom that appears on a lake in one year does not always return in the next.
What Causes Blue-Green Algae
The province lists calm water, high temperatures and a rise in nutrients, phosphorus above all, among the conditions that promote a bloom. Phosphorus added by people comes from shoreline and land erosion, farm and urban runoff, sewage treatment plant effluent and septic systems that are not working properly. Invasive species and a changing climate can also raise nutrient levels in ways that favour blooms.
The province’s phosphorus bands describe the same relationship: nuisance blooms are rare in oligotrophic water, moderate blooms can occur near the top of the mesotrophic band, and eutrophic water can carry persistent ones.
What a Bloom Looks Like
A dense bloom colours the water bright green or blue-green, and sometimes yellow, purple, red or brown, and can gather as a scum or a mat at the surface. Several other things resemble one: mats of aquatic plants such as duckweed or milfoil, which show leaves and stems; yellow pollen in spring, which also coats the ground near the shore; and filamentous green algae, which are harmless. Whether a bloom holds toxins cannot be told from its appearance.
How to Report Blue-Green Algae in Ontario
| Body | What it covers |
|---|---|
| Spills Action CentreMinistry of the Environment, Conservation and Parks | Reports of a suspected bloom, 24 hours a day, 7 days a week: 1-866-MOE-TIPS (1-866-663-8477), TTY 1-855-889-5775, or online. |
| Local public health unit | Health advisories for blue-green algal blooms, beach postings, and notices on drinking water drawn by systems the province does not regulate. |
| Government of Ontario, Blue-green algae | What a bloom is, what to do near one, drinking water, and eating fish caught during a bloom. |
After a report, the ministry works with the local public health unit and its Medical Officer of Health to manage the bloom and to screen samples for toxins. The public health unit issues any advisory and decides whether a beach is posted. A municipal drinking water system that draws from surface water must monitor its source for blooms under its licence.
No list or map of reported blooms is published in Ontario’s open data catalogue. Current advisories are held by each public health unit.
Invasive Species That Change a Lake
Four invasive species change the Ontario lakes they reach: a plant that crowds the shallows, two mussels that filter the water, and a small predator of the plankton. Sightings of each are reported to the Invading Species Hotline at 1-800-563-7711 or through EDDMapS Ontario. The province’s Invading Species Awareness Program is a partnership of the Ministry of Natural Resources and the Ontario Federation of Anglers and Hunters.
Eurasian Milfoil
Eurasian water-milfoil is a submerged aquatic plant, first found in Canada in Lake Erie in 1961. It is now present in the Great Lakes, the St. Lawrence River and many inland lakes of southern and central Ontario, and it spreads from small fragments carried on boats, trailers and fishing gear. It grows into dense mats at the surface that crowd out native plants, draw down oxygen and interfere with swimming, fishing and boating.
Its leaves are finely divided, usually into 12 to 21 pairs of thread-like leaflets, and the native northern water-milfoil usually has fewer than 10 pairs. Ontario regulates Eurasian water-milfoil as a restricted invasive species under the Invasive Species Act, which makes it illegal to bring it into the province, to release or plant it, or to buy or sell it.
Zebra and Quagga Mussels
Zebra and quagga mussels are small invasive mussels that colonize a lake bottom and filter plankton from the water. By removing algae they can leave a lake clearer, which is one reason the province judges nutrient status by phosphorus. On Lake Simcoe the province records both species changing how phosphorus moves through the lake, as described above.
Spiny Water Flea
The spiny water flea is a small predatory zooplankton, 1 to 1.5 centimeters long with a barbed tail spine, first reported in North America in Lake Ontario in 1982. It is recorded in all the Great Lakes and in more than 100 inland lakes in Ontario. It feeds on native zooplankton, whose numbers fall by an average of 30 to 40 percent after an introduction, and so reduces the food of small fish and of young bass, walleye and yellow perch. Its spines collect on fishing line. It spreads on angling gear and in bait buckets, live wells and bilge water, and its eggs survive transport on damp equipment.
Clean, Drain, Dry
Since January 1, 2022, Ontario requires a boater to open or remove drain plugs, and to take reasonable measures to remove plants, animals and algae from the boat, its equipment and its trailer, before moving a boat overland. A boat must also arrive at a launch with none attached.
Where the Records Come From
- The Lake Partner Program. The Ministry of the Environment, Conservation and Parks runs the program through the Dorset Environmental Science Centre, with the Federation of Ontario Cottagers’ Associations as a partner since 1996. Volunteers check the water of about 800 lakes each year, and the province publishes the readings each year as open data. Once flagged and unplaceable readings are set aside, the files hold 44,356 phosphorus readings from 2002 to 2025 and 118,001 Secchi readings.
- Lake Simcoe Monitoring. The ministry’s own sampling of Lake Simcoe at fixed stations, with phosphorus, nitrogen, chlorophyll, clarity, temperature, dissolved oxygen and other measures, published as open data.
- The interpretation guide. The bands, the three-year rule and the sampling methods described here are set out in the province’s Guide to Interpreting Total Phosphorus and Secchi Depth Data from the Lake Partner Program.
Some lake associations run monitoring programs of their own and publish reports for their members.
Common Questions
Is Lake Simcoe water clean?
The province’s Lake Simcoe 15-Year Monitoring Report records ice-free phosphorus falling at all eight lake stations since the 1980s and clarity rising since 1980, while chloride has risen. Over 2015 to 2024 the ice-free phosphorus average ran from 7.8 µg/L at station K45 to 14.1 µg/L at station C1, Cooks Bay 1. Swimming beaches around the lake are tested and posted by the local public health units.
Does the Lake Partner Program sample Lake Simcoe?
The program has seven registered sites on the lake, and two hold a status: site 6982/3, Cedarmont Beach and site 6982/7, Strawberry Island. The province also samples eight lake stations of its own.
What causes blue-green algae?
Blue-green algae, or cyanobacteria, occur naturally in lakes and rivers, and a bloom forms when their numbers rise quickly. The province lists calm water, high temperatures and added nutrients, phosphorus above all, among the conditions that promote one. Added phosphorus comes from erosion, farm and urban runoff, sewage effluent and failing septic systems.
When do blue-green algae blooms happen in Ontario?
Most often in late summer and early fall, although blooms occur in other seasons as well. A bloom on a lake in one year does not always return in the next.
Who issues blue-green algae advisories in Ontario?
The local public health unit issues advisories and decides beach postings. Suspected blooms are reported to the Spills Action Centre at 1-866-MOE-TIPS (1-866-663-8477), 24 hours a day, 7 days a week.
What does oligotrophic mean?
An oligotrophic lake has little phosphorus: under 10 µg/L in the province’s bands. Its water is dilute and unproductive, and nuisance algal blooms are rare. Mesotrophic water runs from 10 to 20 µg/L, and eutrophic water is over 20 µg/L.
What is a Secchi depth?
The depth at which a black and white Secchi disk, lowered on a marked line, disappears from view. A deeper reading means clearer water. Clarity also depends on silt, tea-coloured organic matter and zebra mussels, so the province judges nutrient status by phosphorus.
Which Ontario lakes have the clearest water?
Among the Lake Partner sites with a status on the lakes tabled above, and with twenty or more Secchi readings, the deepest medians are at site 246/1 on Basswood Lake, 11.5 meters across 146 readings; site 4982/1 on Skeleton Lake, 9.2 meters across 207 readings; and site 6553/2 on Miskwabi Lake, 8.3 meters across 178 readings.
How many lakes does the Lake Partner Program monitor?
Volunteers check the water of about 800 lakes each year. The province’s files hold 4,894 monitoring sites, and 1,077 of them reported phosphorus in 2025.
What is Eurasian milfoil?
Eurasian water-milfoil is an invasive submerged plant, first found in Canada in 1961, that grows into dense surface mats in still and slow water. It spreads from fragments carried on boats and gear, and Ontario regulates it as a restricted invasive species. Sightings go to the Invading Species Hotline at 1-800-563-7711.
The Buyer’s Report
Water quality is one record out of many. The Rural and Cottage Buyer’s Report gathers what the public record holds about one specific address: shore road allowance, road access, wells, flood mapping, Crown land, wetlands and more, read and checked by a person before it is sent. Where a Lake Partner site is matched to the property’s water, the report charts that site’s phosphorus and clarity record.
See what is in the report All lake pagesSmall print
- Sites and lakes
- Each phosphorus and clarity figure belongs to a single monitoring site and describes the water at that site. A bay receiving a creek can read differently from open water half a kilometer away. Sites are matched to a lake by name in the province’s records.
- Phosphorus averages
- A site’s long-term average is the average of its yearly averages, and a site receives a band once it holds three years of readings. Lakes on the Canadian Shield are sampled once each spring and lakes off the Shield through the open-water season, when phosphorus often rises, so the two kinds of average are measured on different bases. Readings from before 2002 and pairs of duplicate samples that the province flags as disagreeing (1,777 of them) are left out.
- The bands
- The province’s bands describe nutrient status in most Ontario lakes. Tea-stained lakes, rich in dissolved organic carbon, can hold more phosphorus without the algae the bands describe, and nothing in the records identifies them. A site averaging just under a band’s edge and one just over it differ by little.
- Clarity
- A median Secchi depth is the middle of every reading at the site. Clarity depends on dissolved organic carbon, silt and zebra mussels as well as algae, and the province judges nutrient status by phosphorus alone.
- Records that stopped
- The last year a site reported phosphorus is given beside it. A record that ended describes the years it covers.
- Trends
- Nothing here draws a trend from Lake Partner readings. The province’s guide holds that three years of readings establish an average and do not establish a trend. The Lake Simcoe block averages describe the recorded past and forecast nothing, and the long-run decline in Lake Simcoe phosphorus is the province’s own finding.
- Lake Simcoe stations
- Each Lake Simcoe figure belongs to one station. The ice-free season is taken as May to October. The province’s phosphorus method changed in 2002, and the two methods read differently over the years both were run, so the phosphorus figures given here use the newer method only, from 2015, each sample taken as the average of its duplicate pair. Stations K39, C6 and C1 have no phosphorus sample in 2020.
- Development capacity
- Lakeshore development capacity is assessed by the province and by municipalities with their own models and records, and nothing here states or implies a lake’s capacity.
- Blue-green algae
- Nothing here reports a bloom, or its absence, on any lake on any day. Health advice and advisories belong to the local public health unit.
- Invasive species
- The sighting records held in EDDMapS are not published as open data, and no open register records which lakes hold each species. A lake with no reported sighting may still hold the species.
- Phosphorus and water clarity: Ontario Lake Partner, Ministry of the Environment, Conservation and Parks, LPP_Total_Phosphorus_2025.csv and LPP_Secchi_2025.csv, data.ontario.ca/dataset/ontario-lake-partner, Open Government Licence – Ontario. Extract built 2026-08-09.
- Lake Simcoe stations: Lake Simcoe Monitoring, Ministry of the Environment, Conservation and Parks, LakeSimcoeData_2024a.zip, data.ontario.ca/dataset/lake-simcoe-monitoring, Open Government Licence – Ontario.
- Bands, sampling and the three-year rule: Guide to Interpreting Total Phosphorus and Secchi Depth Data from the Lake Partner Program, Ministry of the Environment, December 2013.
- Lake Simcoe findings: Government of Ontario, Lake Simcoe 15-Year Monitoring Report, published 2025-12-19, read 2026-09-28.
- Blue-green algae and reporting: Government of Ontario, Blue-green algae, read 2026-09-28.
- Invasive species: Government of Ontario, Eurasian water-milfoil; Spiny and fishhook water flea; Invasive species in Ontario; Invading Species Awareness Program, invadingspecies.com, read 2026-09-28.
- The Lake Partner Program: Government of Ontario, Water sampling and testing (inland lakes); Federation of Ontario Cottagers’ Associations, Lake Partner Program, read 2026-09-28.
- Contains information licensed under the Open Government Licence – Ontario.