Simcoe County, York and Durham, Ontario
Lake Simcoe
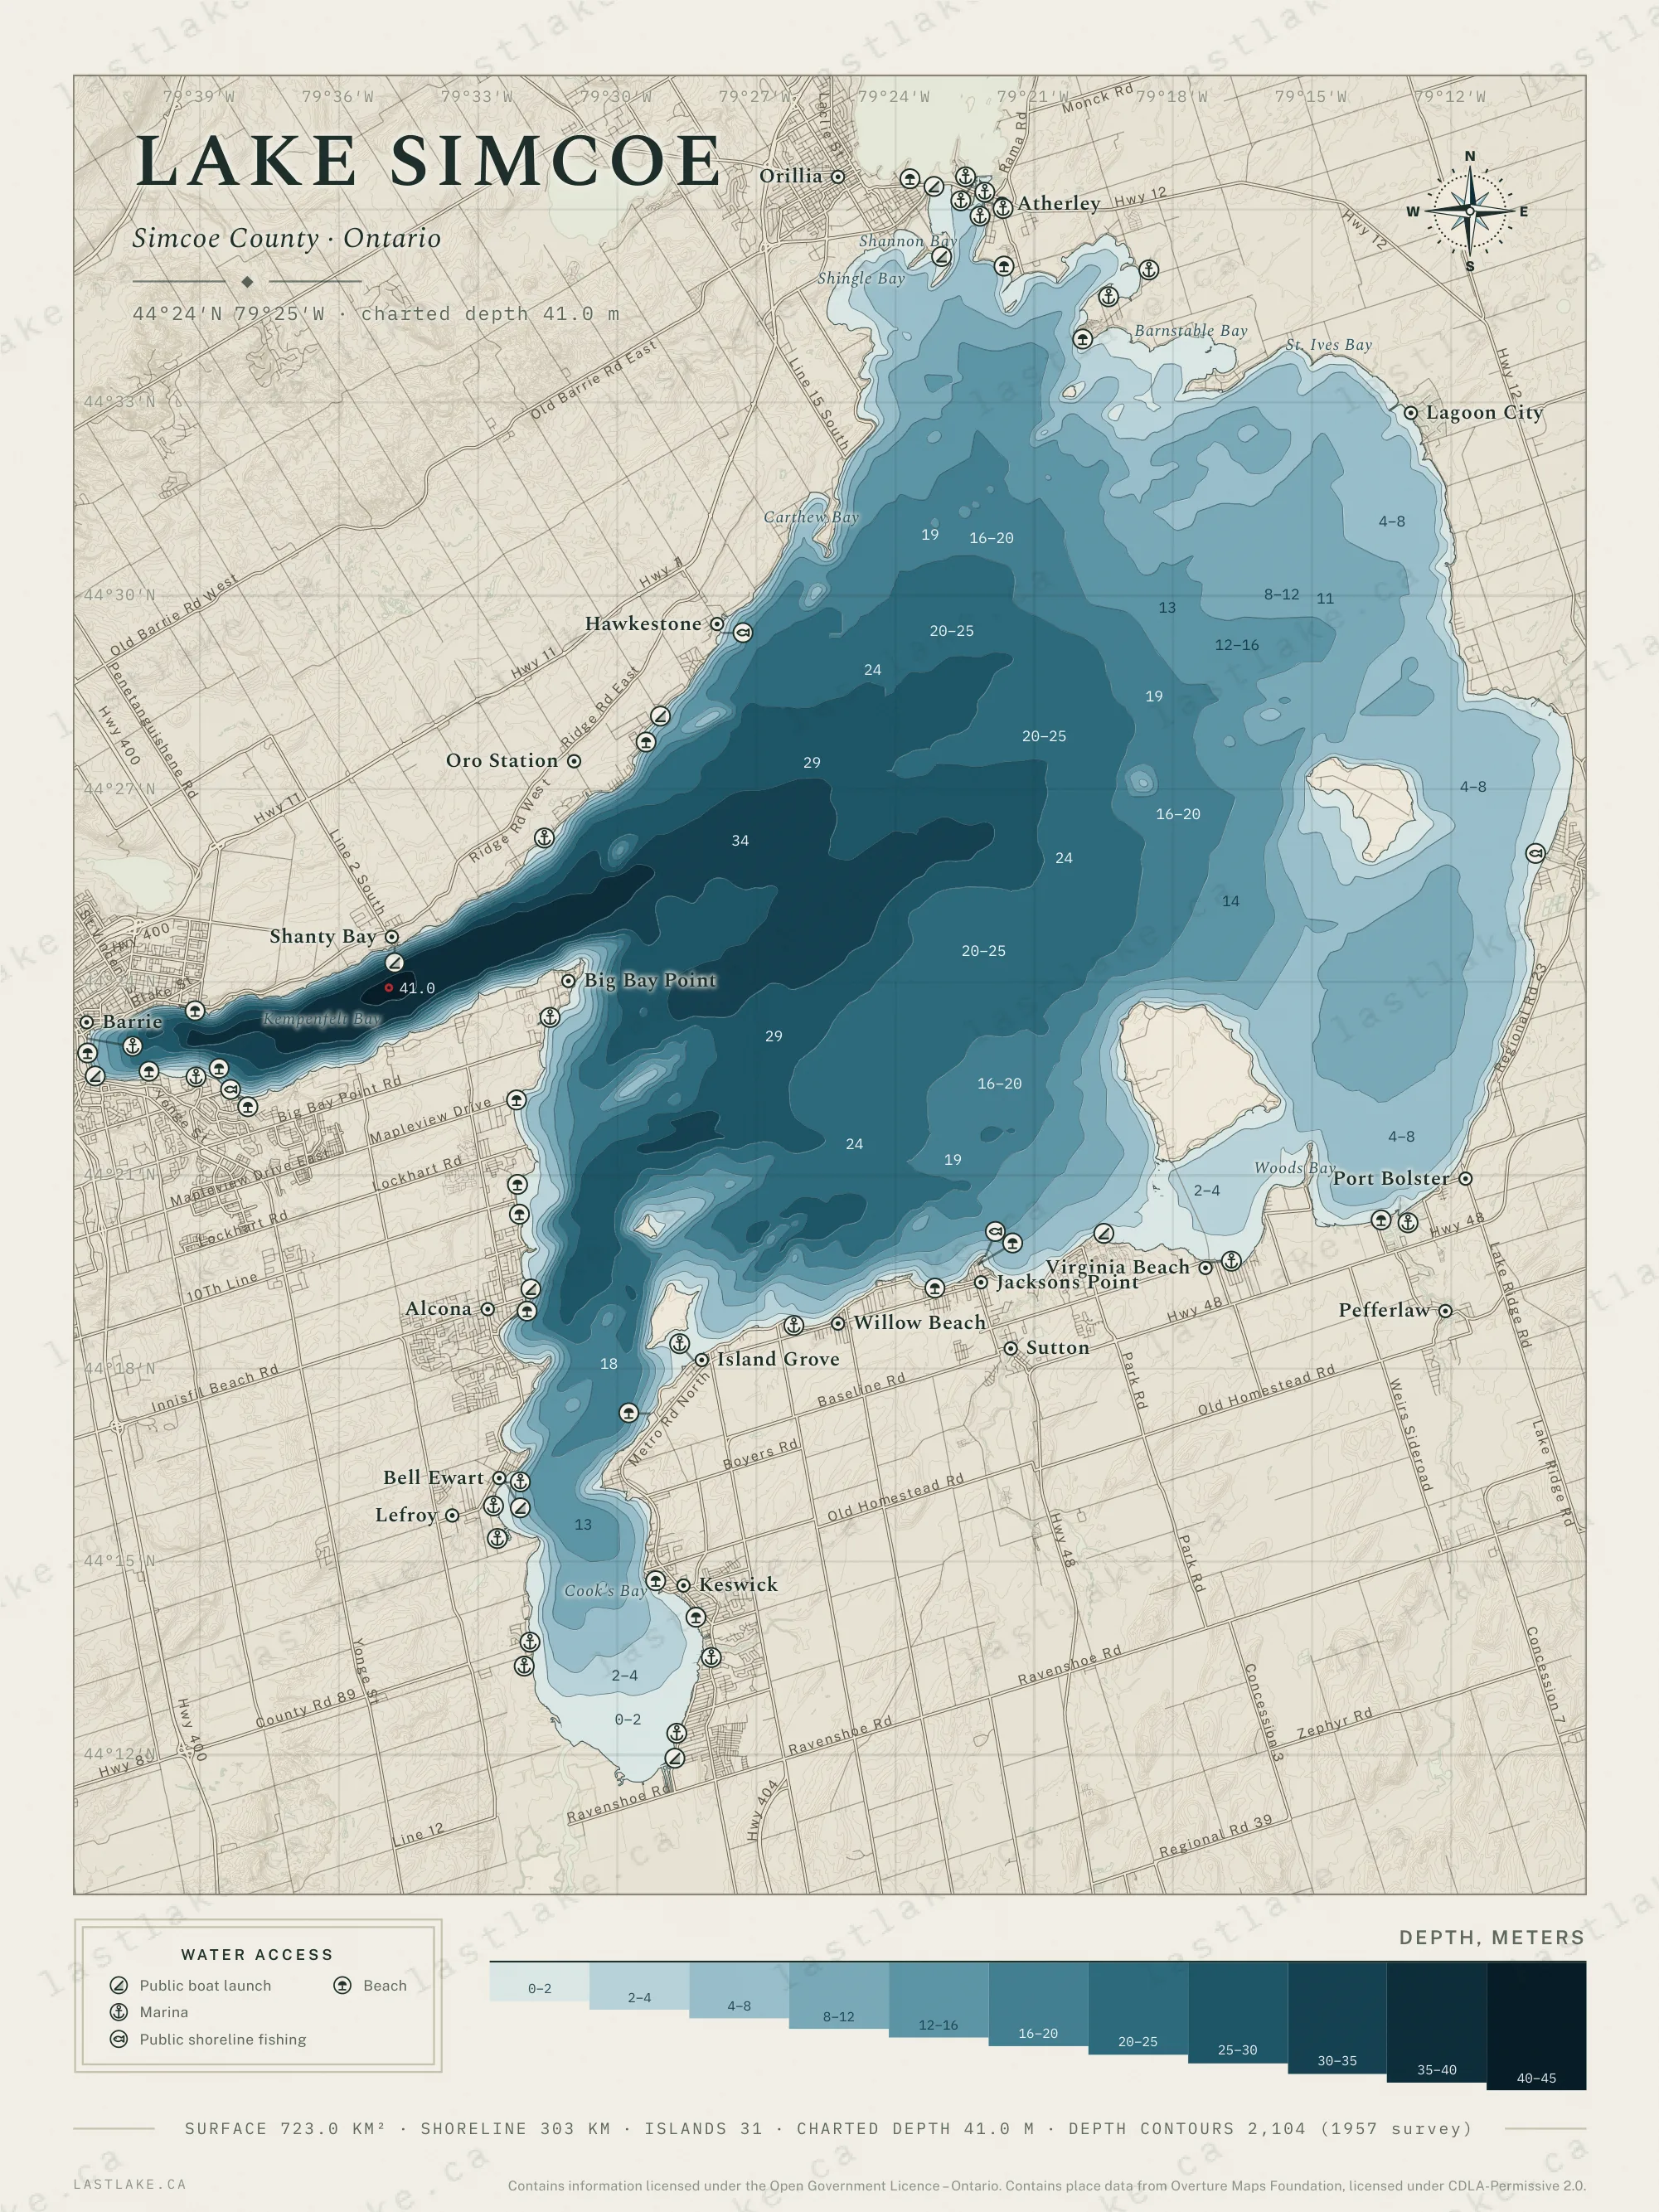
Barrie and Orillia on its shores, Kempenfelt Bay falling to 41 meters on the 1957 chart, and the province's own temperature and oxygen record kept at fixed stations since 1980. The largest lake on the catalogue.
- Surface
- 723.0 km²
- Shoreline
- 303 km254 mainland + 49 islands
- Islands
- 31
- Charted depth
- 41.0 m
- Depth contours
- 2,104
- Survey behind the depths
- 1957 survey
All figures are derived from Ontario’s survey records.
Where Lake Simcoe is
Lake Simcoe lies in the Regional Municipality of Durham, the Regional Municipality of York and the County of Simcoe, with shoreline in the Town of Bradford West Gwillimbury, the Township of Oro-Medonte, the Town of Innisfil, the Township of Ramara, the Town of Georgina, the Township of Brock, the City of Orillia and the City of Barrie.
How deep is Lake Simcoe?
The deepest mapped contour on Lake Simcoe is 41.0 meters, and the water within that boundary descends even farther. The chart is drawn from 2,104 depth contours recorded in Ontario’s 1957 survey.
Surveyed Depths
Ontario has surveyed the depths of several thousand of its lakes over more than half a century. Later surveys were conducted by boat with satellite positioning and produced hundreds of thousands of soundings per lake. Earlier surveys were charted by running transects across the water and drawing depth contours by hand.
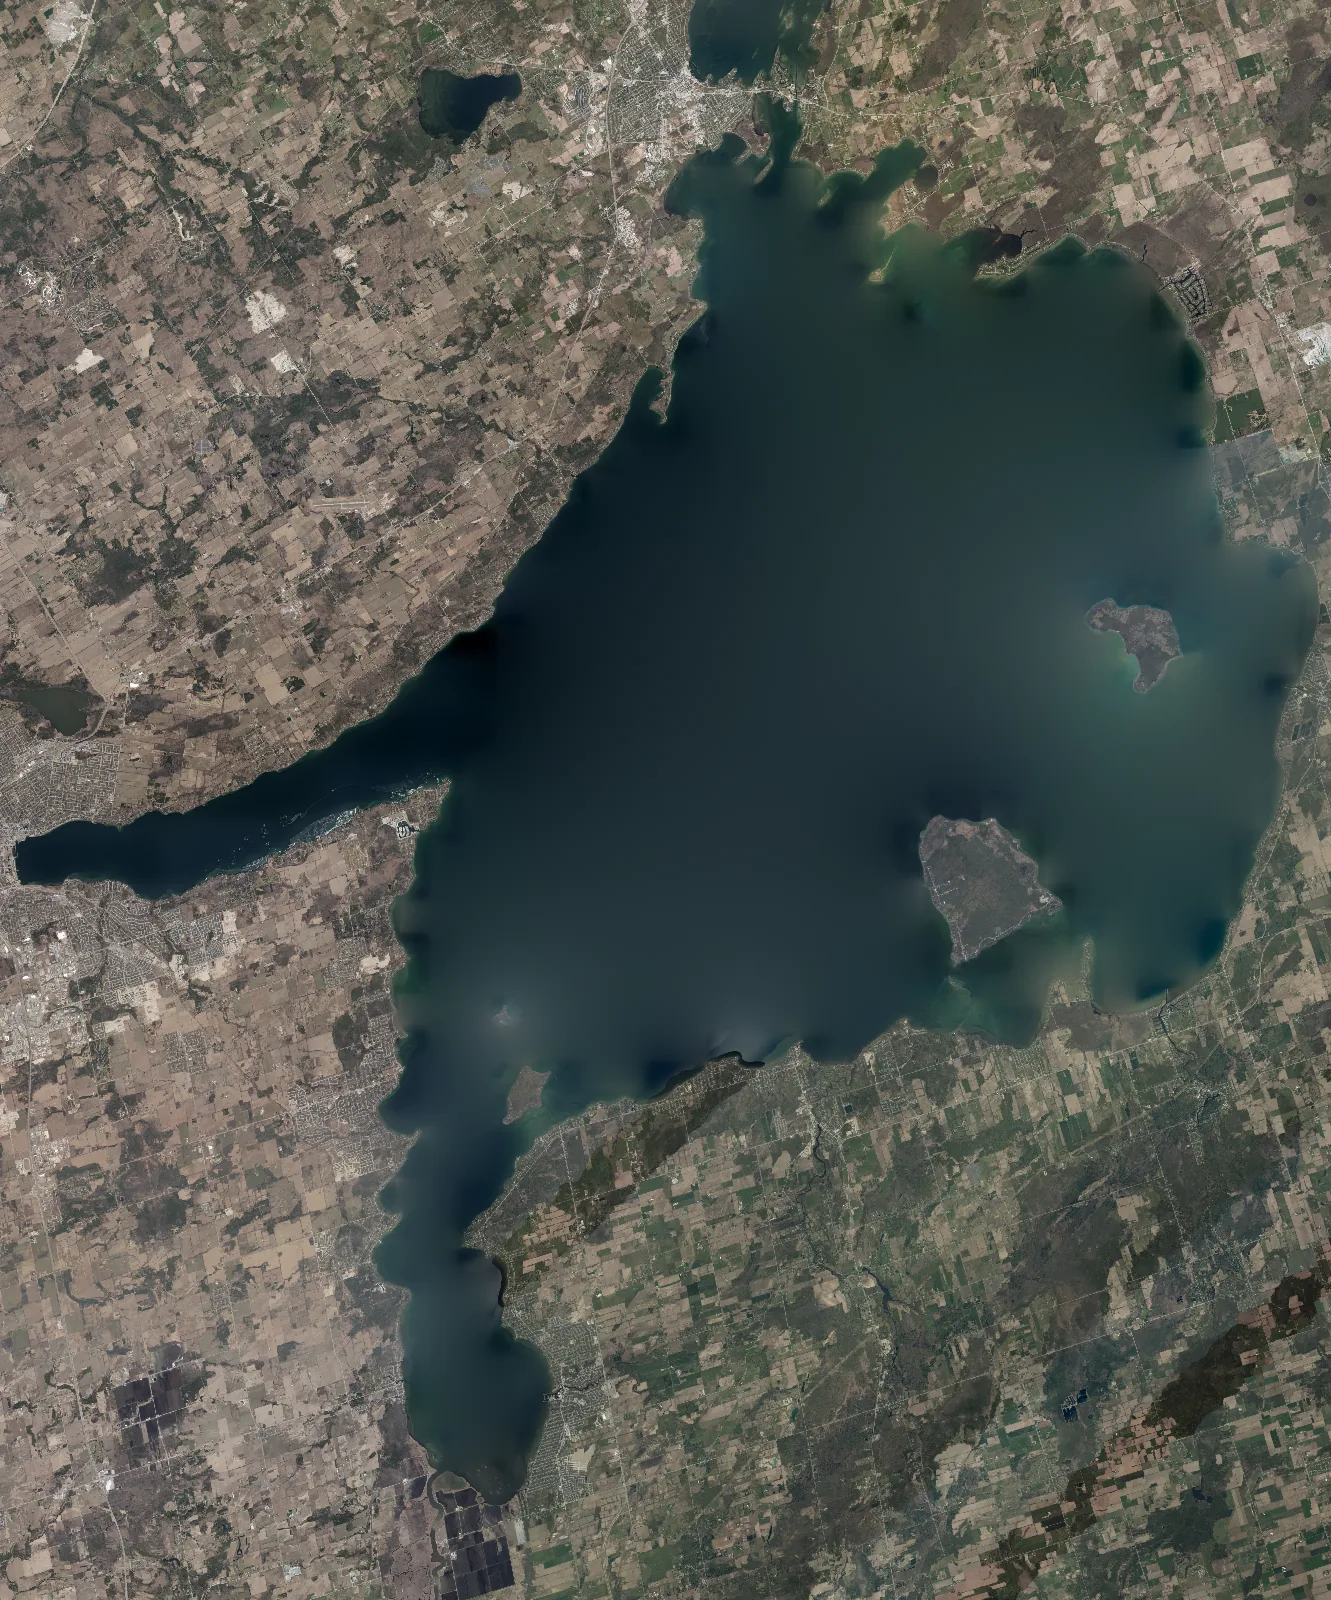
Lake Simcoe Aerial Photography
Ontario photographs the province from the air on a rolling schedule.
The photograph below is from the SCOOP2023 collection. The flights stop short of the open water, so 79.8% of the lake’s surface is painted with water from covered parts of the same photograph, as is the water beside it in the frame; no shore or island is invented.
Water quality
Ontario’s Lake Partner Program is a volunteer monitoring network. Participants collect a water sample each spring for phosphorus analysis and measure water clarity through the summer with a Secchi disk.
Phosphorus is the nutrient that controls how much algae a lake can grow. A lake with little phosphorus stays clear and supports cold-water fish such as lake trout. As phosphorus rises, algae increase, the water clouds, and oxygen in the deep water falls as the algae decay. The province classifies each monitoring site by its spring phosphorus. Below 10 micrograms per litre is oligotrophic: clear water and low algae. From 10 to 20 is mesotrophic: moderately productive water, with more algae and weed growth than an oligotrophic lake but rarely a bloom. Above 20 is eutrophic: nutrient-rich water, prone to algal blooms and low oxygen at depth.
A Secchi disk is a 20 centimeter white or black-and-white plate lowered on a marked line until it disappears from view. The depth at which it vanishes is the Secchi depth, a direct measure of water clarity. Clearer water gives a deeper reading.
Lake Simcoe has 7 Lake Partner monitoring sites. Two have reported phosphorus for the three or more years the province requires before a status is assigned. All are classified mesotrophic.
| Site | Location | Years | Last sampled | Classification |
|---|---|---|---|---|
| 6982/3 | Cedarmont Beach | 23 | 2024 | mesotrophic |
| 6982/7 | Strawberry Island | 8 | 2009 | mesotrophic |
The longest record is held by site 6982/3 at Cedarmont Beach, sampled over 23 springs to 2024. Its long-term mean phosphorus concentration is 12.3 micrograms per litre, within the mesotrophic band, which runs from 10 to 20. The site’s 169 clarity readings give a median Secchi depth of 4.0 meters.
Water temperature
Ontario’s aquatic resource records class Lake Simcoe as a cool-water lake, with a mean depth of 17 meters against its maximum of 41.
Lake Simcoe is one of the few lakes in Ontario with a long temperature record of its own. The Ministry of the Environment, Conservation and Parks has sampled temperature and dissolved oxygen at fixed stations on the lake since 1980, at the surface and at every meter to the bottom, about every two weeks from spring to autumn and on a few winter dates through the ice. The record holds 102,757 readings at twelve stations on the lake, eight of which were still sampled in 2024, with a further three stations on the Holland River that are left out of every figure here. Station K42 in Kempenfelt Bay, 43 meters deep, carries the longest record, 554 profiles over 45 years.
The stations do not read alike on one day. In April and May, when Cook’s Bay and the shallow stations warm first, the warmest and the coolest station sampled on the same day differed by about 4.2 degrees at one meter; from June to August the difference was about 3.5 degrees. Each row in the table is that station’s own record and none is a figure for the lake.
| Station | Where | Depth, m | Sampled | Profiles | July at 1 m, °C |
|---|---|---|---|---|---|
| C1 | Cooks Bay 1 | 3.2 | 1980 to 2024 | 493 | 22.1 |
| C6 | Cooks Bay 6 | 13.4 | 1980 to 2024 | 495 | 22 |
| C9 | Cooks Bay 9 | 20 | 1980 to 2024 | 529 | 21.6 |
| E50 | E50 | 13 | 1980 to 2013 | 263 | 21.6 |
| E51 | E51 | 13.5 | 1980 to 2024 | 504 | 21.6 |
| K38 | Kempenfelt Bay 38 | 19 | 1982 to 1999 | 200 | 18.1 |
| K39 | Kempenfelt Bay 39 | 36 | 1980 to 2024 | 522 | 20.6 |
| K42 | Kempenfelt Bay 42 | 43 | 1980 to 2024 | 554 | 21.2 |
| K45 | Kempenfelt Bay 45 | 40 | 1980 to 2024 | 537 | 21.5 |
| N31 | N31 | 12 | 1980 to 1999 | 194 | 20.6 |
| N32 | N32 | 7.3 | 1981 to 2013 | 257 | 20.9 |
| S15 | S15 | 21 | 1985 to 2024 | 484 | 21.7 |
How depth changes the temperature
The chart below is the province’s record at station K42, 43 meters deep, drawn as the median temperature at each depth for each month over 45 years. In July the water at one meter is 21 degrees, at ten meters 17, at twenty meters 10, and near the bottom 7. By September the surface has cooled to 19 degrees and the water at twenty meters has warmed to 12 as the warm layer deepens. In February the water at one meter under the ice is 0.5 degrees.
- February, under ice
- May
- June
- July
- August
- September
- October
Oxygen in the deep water
The same profiles record dissolved oxygen. Through the summer the deep water of Lake Simcoe is cut off from the air by the warm layer above it, and the oxygen it holds is consumed as algae settle and decay. Cold-water fish such as lake trout and lake whitefish need that deep water to hold oxygen through to autumn. The Lake Simcoe Protection Plan, in force since 2009, set a target of 7 milligrams per litre for the deep water at the end of summer.
Fish in Lake Simcoe
Ontario’s aquatic resource records name 66 fish species in Lake Simcoe. The province classes the lake as cool water. The record took effect on 12 April 2019, and it compiles what field biologists had reported by then.
Twenty-two of the 66 species in the province’s records
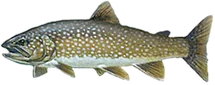 Lake Trouttrout and whitefish
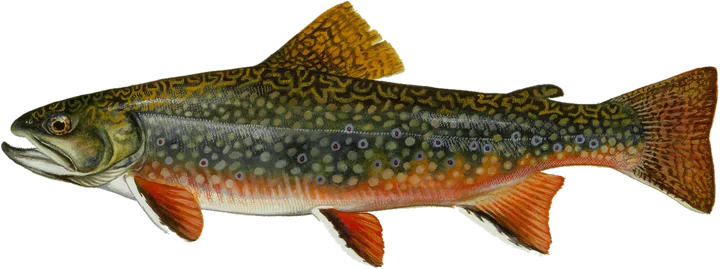 Brook Trouttrout and whitefish
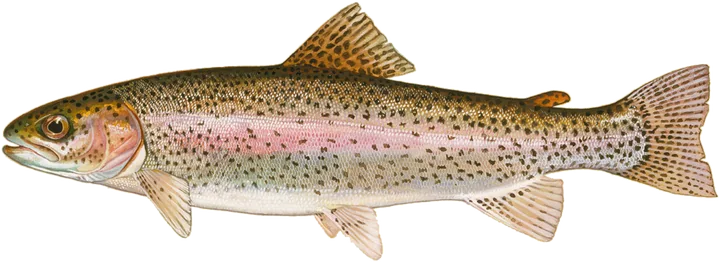 Rainbow Trouttrout and whitefish
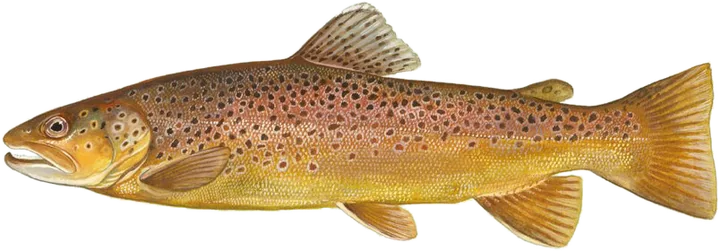 Brown Trouttrout and whitefish
 Lake Whitefishtrout and whitefish
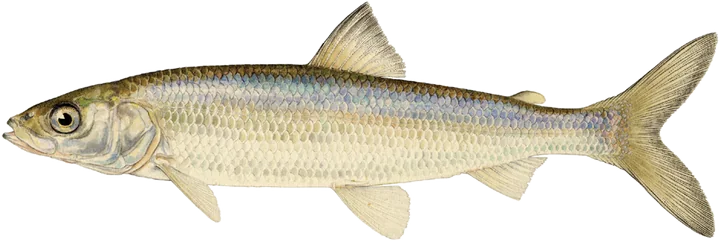 Ciscotrout and whitefish
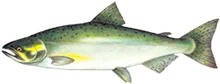 Chinook Salmontrout and whitefish
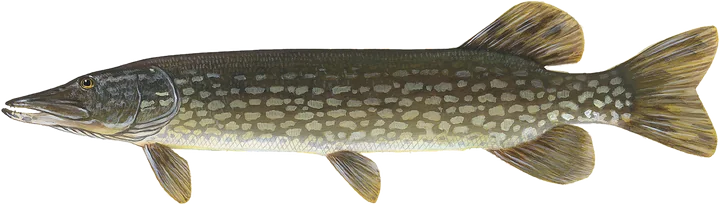 Northern Pikepike
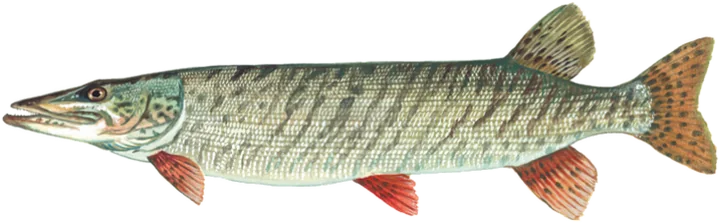 Muskellungepike
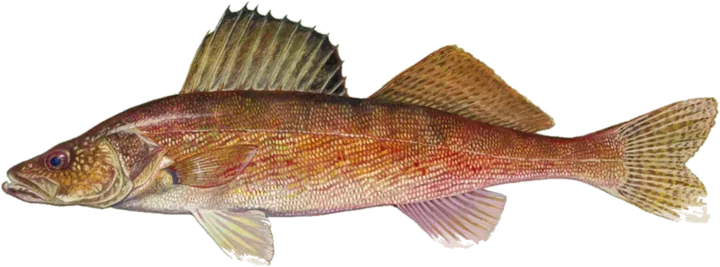 Walleyeperch
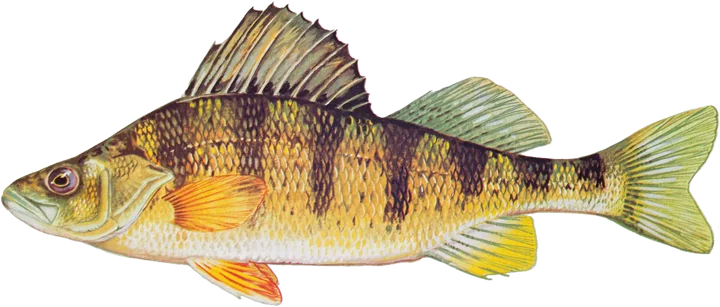 Yellow Perchperch
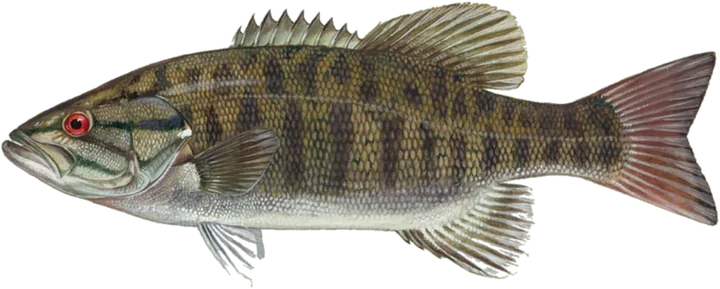 Smallmouth Basssunfish
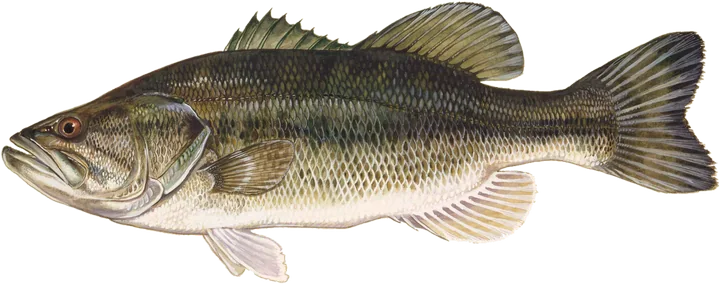 Largemouth Basssunfish
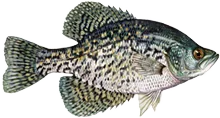 Black Crappiesunfish
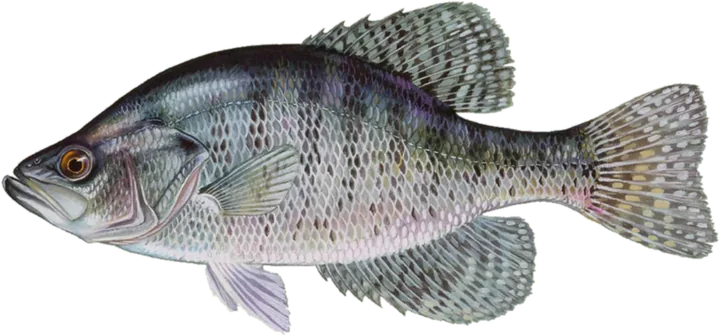 White Crappiesunfish
 Rock Basssunfish
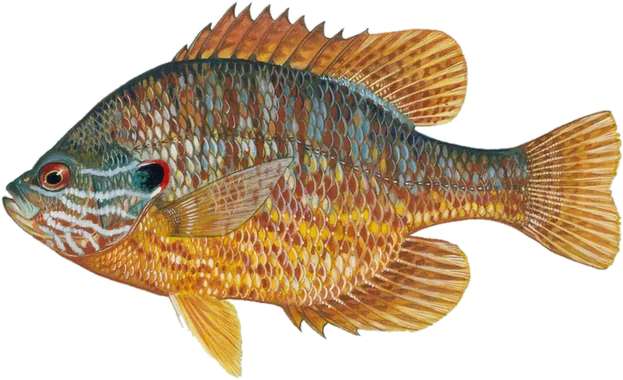 Pumpkinseedsunfish
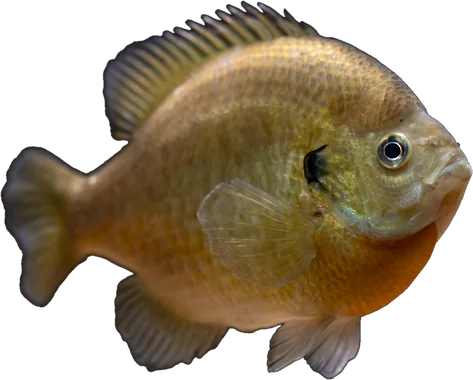 Bluegillsunfish
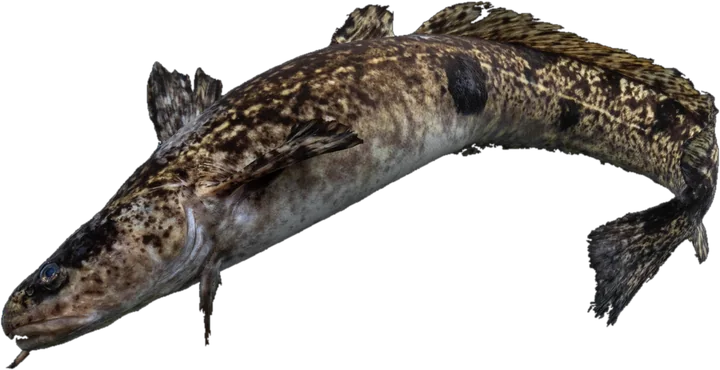 Burbotcod
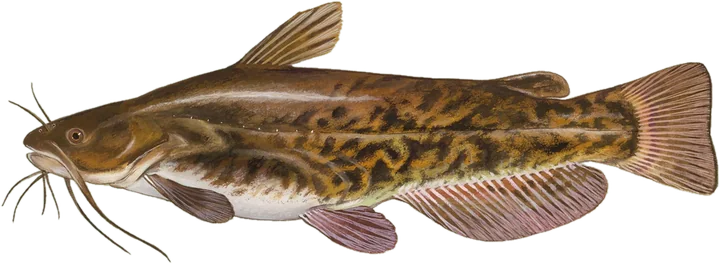 Brown Bullheadcatfish
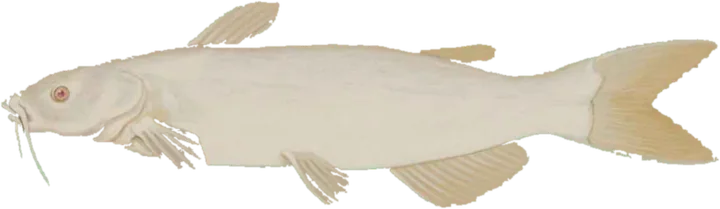 Channel Catfishcatfish
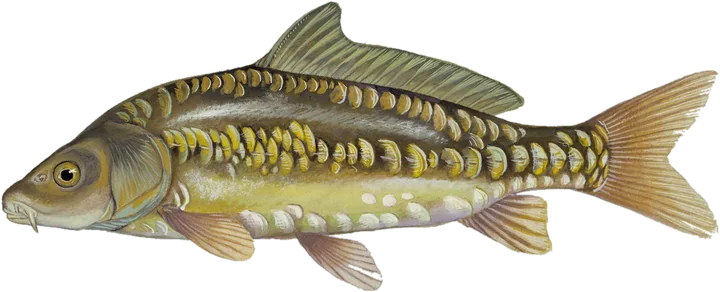 Common Carpminnow
| Family | Species |
|---|---|
| Perch | iowa darter, johnny darter, johnny darter x tesselated darter, logperch, rainbow darter |
| Catfish | yellow bullhead |
| Sucker | longnose sucker, shorthead redhorse, white sucker |
| Smelt | rainbow smelt |
| Minnow | blackchin shiner, blacknose dace, blacknose shiner, bluntnose minnow, brassy minnow, carps and minnows, common shiner, creek chub, emerald shiner, fathead minnow, finescale dace, golden shiner, hornyhead chub, longnose dace, northern pearl dace, northern redbelly dace, river chub, sand shiner, spotfin shiner, spottail shiner |
| Sculpin | mottled sculpin, slimy sculpin, spoonhead sculpin |
| Stickleback | brook stickleback, ninespine stickleback |
| Herring | gizzard shad |
| Eel | american eel |
| Gar | longnose gar |
| Bowfin | bowfin |
| Killifish | banded killifish |
| Mudminnow | central mudminnow |
| Silverside | brook silverside |
| Trout-perch | trout-perch |
| Goby | round goby |
Spawning areas
Ontario maps 109 fish spawning records within the Lake Simcoe outline, for six species. Three are records of under 100 square meters each, and the other 106 are mapped areas. Twenty-three of the areas are one outline mapped for cisco (lake herring), lake whitefish and lake trout alike, and four more are filed under more than one species. An outline filed for more than one species is drawn once, striped in each of their colours.
By number of records
By area mapped
- Cisco (Lake Herring)32 areas1677.2 ha
- Lake Whitefish31 areas1591.6 ha
- Lake Trout31 areas1677.2 ha
- Northern Pike10 areas1114.4 ha
- Muskellunge3 records100 m²
- Walleye1 area21.8 ha
- Walleye nursery1 area21.8 ha
The federal Fisheries Act prohibits the harmful alteration, disruption or destruction of fish habitat without an authorization, so a dock, dredging, infill or shoreline work at a mapped spawning area is reviewed on that basis.
Stocking history
Ontario’s stocking records for Lake Simcoe run from 1946 to 2015 and hold 768 releases. Lake Whitefish account for most of the fish: 22,328,649 released in 28 of the years between 1949 and 2000. The last recorded release was 1,146 muskellunge fingerlings in 2015.
| Species | Years | Years with a release | Fish released |
|---|---|---|---|
| Lake Whitefish | 1949 to 2000 | 28 | 22,328,649 |
| Walleye | 1946 to 1966 | 11 | 10,095,023 |
| Lake Trout | 1946 to 2015 | 70 | 6,333,558 |
| Lake Whitefish | 2001 to 2015 | 15 | 2,104,428 |
| Muskellunge | 1948 to 2015 | 23 | 1,177,977 |
| Smallmouth Bass | 1946 to 1966 | 15 | 524,241 |
| Lake Herring | 1949 to 1949 | 1 | 200,000 |
| Largemouth Bass | 1946 to 1968 | 3 | 30,500 |
| Brook Trout | 1965 to 1965 | 1 | 2,500 |
| Rock Bass | 1966 to 1966 | 1 | 36 |
| White Sucker | 1966 to 1966 | 1 | 33 |
| Sunfishes | 1966 to 1966 | 1 | 30 |
| Burbot | 1965 to 1966 | 2 | 16 |
| Catfishes | 1965 to 1966 | 2 | 13 |
| Northern Pike | 1964 to 1966 | 2 | 11 |
| Bowfin | 1966 to 1966 | 1 | 10 |
| Perches | 1964 to 1964 | 1 | 3 |
The province’s current stocking programme, recorded from 2016, lists 1,379,916 lake whitefish released into Lake Simcoe between 2016 and 2025.
Eating the fish
The 2025 Guide to Eating Ontario Fish carries consumption advice for eighteen species taken from Lake Simcoe, tested for contaminants at a sampling location in Simcoe Co., York & Durham R.M. Each figure below is the most meals a month the guide advises for a fish of that length. The advice falls as the fish gets longer, because mercury accumulates over a fish’s life. A zero means the guide advises no meals of that fish at that size.
General population adultsSensitive population children under fifteen, women who are or may become pregnant
| Length, cm | 20 to 25 | 25 to 30 | 30 to 35 | 35 to 40 | 40 to 45 | 45 to 50 | 50 to 55 | 55 to 60 | 60 to 65 | 65 to 70 | 70 to 75 | over 75 |
|---|---|---|---|---|---|---|---|---|---|---|---|---|
| General population | 16 | 16 | 16 | 12 | 12 | 12 | 8 | 4 | 4 | 4 | 4 | 2 |
| Sensitive population | 16 | 16 | 16 | 12 | 12 | 12 | 8 | 4 | 4 | 4 | 4 | 0 |
| Length, cm | 20 to 25 | 25 to 30 | 30 to 35 | 35 to 40 | 40 to 45 | 45 to 50 | 50 to 55 | 55 to 60 | 60 to 65 | 65 to 70 | 70 to 75 |
|---|---|---|---|---|---|---|---|---|---|---|---|
| General population | 16 | 16 | 16 | 16 | 16 | 16 | 16 | 12 | 8 | 4 | 2 |
| Sensitive population | 16 | 16 | 16 | 16 | 16 | 16 | 16 | 12 | 8 | 4 | 0 |
| Length, cm | 15 to 20 | 20 to 25 | 25 to 30 | 30 to 35 | 35 to 40 | 40 to 45 |
|---|---|---|---|---|---|---|
| General population | 16 | 16 | 16 | 16 | 16 | 16 |
| Sensitive population | 16 | 16 | 16 | 16 | 12 | 12 |
| Length, cm | 25 to 30 | 30 to 35 | 35 to 40 | 40 to 45 | 45 to 50 | 50 to 55 | 55 to 60 | 60 to 65 | 65 to 70 | 70 to 75 | over 75 |
|---|---|---|---|---|---|---|---|---|---|---|---|
| General population | 16 | 16 | 16 | 16 | 8 | 8 | 8 | 4 | 4 | 4 | 0 |
| Sensitive population | 16 | 16 | 12 | 8 | 4 | 0 | 0 | 0 | 0 | 0 | 0 |
| Length, cm | 30 to 35 | 35 to 40 | 40 to 45 | 45 to 50 | 50 to 55 | 55 to 60 | 60 to 65 | 65 to 70 | 70 to 75 | over 75 |
|---|---|---|---|---|---|---|---|---|---|---|
| General population | 16 | 16 | 16 | 16 | 16 | 16 | 16 | 16 | 16 | 16 |
| Sensitive population | 16 | 16 | 16 | 12 | 12 | 12 | 12 | 8 | 8 | 4 |
| Length, cm | 15 to 20 | 20 to 25 | 25 to 30 | 30 to 35 | 35 to 40 | 40 to 45 | 45 to 50 | 50 to 55 |
|---|---|---|---|---|---|---|---|---|
| General population | 16 | 16 | 16 | 16 | 16 | 16 | 12 | 8 |
| Sensitive population | 16 | 16 | 16 | 12 | 8 | 4 | 4 | 0 |
| Length, cm | 15 to 20 | 20 to 25 | 25 to 30 | 30 to 35 | 35 to 40 | 40 to 45 | 45 to 50 |
|---|---|---|---|---|---|---|---|
| General population | 16 | 16 | 16 | 16 | 16 | 12 | 12 |
| Sensitive population | 16 | 16 | 16 | 16 | 8 | 4 | 4 |
| Length, cm | 15 to 20 | 20 to 25 | 25 to 30 | 30 to 35 | 35 to 40 |
|---|---|---|---|---|---|
| General population | 32 | 32 | 16 | 16 | 16 |
| Sensitive population | 16 | 12 | 8 | 8 | 4 |
| Length, cm | 15 to 20 | 20 to 25 | 25 to 30 | 30 to 35 |
|---|---|---|---|---|
| General population | 16 | 12 | 8 | 8 |
| Sensitive population | 16 | 12 | 8 | 8 |
| Length, cm | 15 to 20 | 20 to 25 | 25 to 30 |
|---|---|---|---|
| General population | 16 | 16 | 12 |
| Sensitive population | 16 | 8 | 4 |
| Length, cm | 15 to 20 | 20 to 25 |
|---|---|---|
| General population | 16 | 16 |
| Sensitive population | 16 | 16 |
| Length, cm | 25 to 30 | 30 to 35 | 35 to 40 | 40 to 45 | 45 to 50 | 50 to 55 | 55 to 60 | 60 to 65 | 65 to 70 | 70 to 75 | over 75 |
|---|---|---|---|---|---|---|---|---|---|---|---|
| General population | 16 | 16 | 16 | 16 | 16 | 16 | 16 | 16 | 16 | 12 | 4 |
| Sensitive population | 12 | 12 | 8 | 8 | 8 | 8 | 8 | 8 | 8 | 4 | 0 |
| Length, cm | 15 to 20 | 20 to 25 | 25 to 30 | 30 to 35 | 35 to 40 |
|---|---|---|---|---|---|
| General population | 16 | 16 | 16 | 16 | 8 |
| Sensitive population | 16 | 16 | 8 | 4 | 4 |
| Length, cm | 25 to 30 | 30 to 35 | 35 to 40 | 40 to 45 | 45 to 50 | 50 to 55 | 55 to 60 |
|---|---|---|---|---|---|---|---|
| General population | 32 | 32 | 32 | 32 | 32 | 32 | 32 |
| Sensitive population | 32 | 32 | 32 | 16 | 16 | 12 | 12 |
| Length, cm | 15 to 20 | 20 to 25 | 25 to 30 | 30 to 35 | 35 to 40 | 40 to 45 | 45 to 50 | 50 to 55 | 55 to 60 | 60 to 65 | 65 to 70 | 70 to 75 | over 75 |
|---|---|---|---|---|---|---|---|---|---|---|---|---|---|
| General population | 16 | 16 | 16 | 16 | 16 | 16 | 16 | 16 | 16 | 16 | 16 | 16 | 8 |
| Sensitive population | 16 | 16 | 16 | 16 | 16 | 16 | 16 | 16 | 16 | 16 | 16 | 16 | 8 |
| Length, cm | 15 to 20 |
|---|---|
| General population | 16 |
| Sensitive population | 16 |
| Length, cm | 45 to 50 | 50 to 55 | 55 to 60 | 60 to 65 | 65 to 70 | 70 to 75 |
|---|---|---|---|---|---|---|
| General population | 16 | 16 | 16 | 12 | 8 | 4 |
| Sensitive population | 8 | 8 | 8 | 4 | 4 | 0 |
| Length, cm | 15 to 20 | 20 to 25 |
|---|---|---|
| General population | 8 | 8 |
| Sensitive population | 8 | 8 |
Fisheries Management Zone 16
Lake Simcoe lies in Fisheries Management Zone 16. Ontario sets its fishing seasons and catch limits by zone. Zone 16 is the most southerly inland zone in the province and takes in all of southwestern Ontario, with Toronto, Mississauga, Hamilton, Kitchener-Waterloo and London. The province describes it as a zone of large river systems, with Lake Simcoe and Lake Couchiching its large lakes, carrying important recreational and tourism fisheries under high fishing effort.
| Species | Open season | Sport licence | Conservation licence |
|---|---|---|---|
| Atlantic Salmon | 4th Sat. in Apr. to Sept 30 | 0 | 0 |
| Brook Trout | 4th Sat. in Apr. – Sept. 30 | 5 | 2 |
| Brown Trout | 4th Sat. in Apr. – Sept. 30 | 5 | 2 |
| Channel Catfish | Open all year | 12 | 6 |
| Crappie | Open all year | 30 | 10 |
| Lake Trout | Jan. 1 – Sept. 30 | 2 | 1 |
| Lake Whitefish | Open all year | 12 | 6 |
| Largemouth and Smallmouth Bass or any combination | 4th Sat. in June – Nov. 30 | 6 | 2 |
| Muskellunge | 1st Sat. in June – Dec. 15 | 1, must be greater than 91 cm (36 in.) | 0 |
| Northern Pike | Jan. 1 – Mar. 31 & 2nd Sat. in May – Dec. 31 | 6 | 2 |
| Pacific Salmon | 4th Sat. in Apr. – Sept. 30 | 5 | 2 |
| Rainbow Trout | 4th Sat. in Apr. – Sept. 30 | 2 | 1 |
| Splake | Open all year | 5 | 2 |
| Sunfish | Open all year | 50 | 25 |
| Walleye and Sauger or any combination | Jan. 1 – Mar. 15 & 2nd Sat. in May – Dec. 31 | 4, not more than 1 greater than 46 cm (18.1 in.) | 2, not more than 1 greater than 46 cm (18.1 in.) |
| Yellow Perch | Open all year | 50 | 25 |
The figures are the number of fish an angler may catch and keep in a day and have in possession, under a sport fishing licence and under a conservation licence. The rows are the whole zone’s, and they apply to every lake in it.
| Species | Open season | Sport licence | Conservation licence |
|---|---|---|---|
| Lake Herring (Cisco) | Jan. 1 – Mar. 15 & 2nd Sat. in May – Sept. 30 | 2 | 1 |
| Yellow Perch | Zone-wide | 50 in one day; 100 | 25 in one day; 50 |
| Muskellunge | Closed all year | Zone-wide | Zone-wide |
| Lake Trout | Jan. 1 – Mar. 15 & 2nd Sat. in May – Sept. 30 | Zone-wide | Zone-wide |
| Lake Whitefish | Jan. 1 – Mar. 15 & 2nd Sat. in May – Sept. 30 | 2 | 1 |
Where a row reads zone-wide, the zone’s own season or limit above applies.
| Where | Closed |
|---|---|
| Pefferlaw Brook in the Town of Georgina, from Hwy. 48 upstream to the dam in the village of Pefferlaw | No fishing from Mar. 1 – Fri. before 2nd Sat. in May |
| Beaver River – Thorah Twp., from the CNR railway bridge in the town of Beaverton upstream to Hwy. 12/48 | No fishing from Mar. 1 – Fri. before 2nd Sat. in May |
Lake Simcoe Ice Fishing
An ice hut on Lake Simcoe must be removed by March 15. Lake Simcoe lies in fisheries management zone 16, one of the twenty zones Ontario sets its fishing rules by, and one removal date applies across the whole zone.
An ice hut must also be removed before the ice breaks up, whether or not that date has passed. The deadline clears huts from the ice ahead of the thaw and does not close the fishing season.
Registration is required in zone 16 for an ice hut built of anything other than fabric, and for a fabric tent covering seven square meters or more. Registration is free, and the number is displayed on the outside of the hut.
When the ice comes and goes
Ice has been recorded at Kempenfelt Bay at Barrie in 172 winters since 1852, the longest of the ice records behind these pages. The median date of complete ice cover is December 28 and the median date of complete ice loss is April 18, a median season of 109 days.
The longest recorded season is 152 days in 1875-76, and the shortest is 49 days in 2023-24.
Averaged twenty winters at a time, the date of complete ice cover has moved later: December 19 in the winters from 1860, and January 8 in those from 2000. Across the same two blocks the average season has gone from 126 days to 95.
The first part of the record was assembled from reports in Barrie newspapers back to 1852, and it has been added to year by year since, most recently by Alex Mills, York University.
Ice conditions
No public record reports the thickness or the condition of the ice on Lake Simcoe on any given day. Ontario publishes ice safety guidance for anyone going out on the ice, at ontario.ca.
Getting on the water
Fifty-four access marks are mapped on Lake Simcoe: nine boat launches, four shoreline access points, twenty-two marinas and nineteen beaches. Ten are Ontario’s own records, twenty-one are from the Overture Places dataset and twenty-three are operator entries, and the list under the map says which is which. Boat launch is the province’s class for a ramp; shoreline access is its class for a place the public can reach the water on foot.
Boat launches 9
- 1Barrie, Tiffin Street area ramp (register gives no site name)
- 2Bell Ewartoperator entry
- 3City of Orillia, Collins Drive
- 4Cook's Bay, south endoperator entry
- 5Innisfil Beach Park ramp (register: 'Public Access')
- 6Oro-Medonte ramp near Parkside Beach (register: 'Public Access')
- 7Shannon Bay narrowsoperator entry
- 8Shanty Bayoperator entry
- 9Sibbald Point Park
Shoreline access 4
- 10Beaver River, Beavertonoperator entry
- 11Dock Road Parkoperator entry
- 12Hawkestone Dockoperator entry
- 13Jackson's Point
Marinas 22
- 14Baer HarbourOverture Places
- 15BigEast MarineOverture Places
- 16Blue Beacon MarinaOverture Places
- 17Brentwood MarineOverture Places
- 18Bridge Port MarinaOverture Places
- 19C.W. Marine and PowersportsOverture Places
- 20City of Barrie MarinaOverture Places
- 21Cooks Bay MarinaOverture Places
- 22Crothers Twin Lakes MarinaOverture Places
- 23Flying Bridge MarinaOverture Places
- 24Friday Harbouroperator entry
- 25Island Grove MarinaOverture Places
- 26Kon-Tiki MarineOverture Places
- 27Krates KeswickOverture Places
- 28Lake Simcoe MarinaOverture Places
- 29Lefroy HarbourOverture Places
- 30Lotus MarineOverture Places
- 31Marina del ReyOverture Places
- 32Mariposa LandingOverture Places
- 33Monto-Reno MarinaOverture Places
- 34Starport MarinaOverture Places
- 35Virginia Beach MarinaOverture Places
Beaches 19
- 36Alcona Beach
- 37Bayview Memorial Parkoperator entry
- 38Beach north of Keswickoperator entry
- 39Centennial Beachoperator entry
- 40Claredon Beach Parkoperator entry
- 41De La Salle Beachoperator entry
- 42Dock Road Parkoperator entry
- 43Innisfil Beachoperator entry
- 44Jackson's Point Harbouroperator entry
- 45Johnson's Beach Parkoperator entry
- 46Leonard Parkoperator entry
- 47Mapleview Parkoperator entry
- 48Mara Provincial Parkoperator entry
- 49McRae Point Provincial Park
- 50Minet's Point Parkoperator entry
- 51Moose Beach
- 52North Gwillimbury Parkoperator entry
- 53Sunnybrook Beach
- 54Tyndale Beachoperator entry
Islands and names
Lake Simcoe contains 31 islands in the Ontario Hydro Network’s outline, six of them over 10 hectares and thirteen under a tenth of a hectare. Nine of them lie inside wetlands mapped in the province’s Wetland With Significance dataset. The largest two, of 1.3 and 1.1 hectares, fall inside the Atherley-Sucker Creek Wetland Complex (RM1) and Barnstable Bay Swamp (RM2). Georgina Island, at 1,289 hectares, is larger than the next ten together, which cover 627.
| Island | Hectares | |
|---|---|---|
| 1 | Georgina Island | 1,288.9 |
| 2 | Thorah Island | 441.6 |
| 3 | Snake Island | 135.2 |
| 4 | Fox Island | 20.2 |
| 5 | Grape Island | 11.0 |
| 6 | Strawberry Island | 10.5 |
| 7 | Goffatt Island | 4.8 |
| 8 | unnamed | 1.4 |
| 9 | unnamed | 1.3 |
| 10 | unnamed | 0.4 |
Official names
Ontario’s geographic names register lists 67 official names on the water and its islands: 9 islands, twelve bays, 21 shoals, one harbour, nine points on islands and one river. A further 31 named points stand on the mainland shore. The register records the origin of one name: Burts Creek, “Local name.”
Bays 12
- Barnstable Bay
- Bradens Bay
- Carthew Bay
- Cook's Bay
- Invermara Bay
- Kempenfelt Bay
- McPhee Bay
- Shannon Bay
- Shingle Bay
- Smith's Bay
- St. Ives Bay
- Woods Bay
Shoals and rocks 21
- Bald Shoal
- Big Shoal
- Cedar Shoal
- Centre Shoal
- Cook's Bay Shoal
- Eight Mile Shoal
- Fox Island Shoal
- Hawkestone Shoal
- Jimmy Warren Shoal
- Long Shoal
- Mara Shoal
- Maynards Shoal
- McRae Shoal
- Moons Shoal
- The Ninth Shoal
- Townline Shoal
- Trout Shoal
- Whiskey Shoal
- White Shoal
- Whitefish Shoal
- Woodman Shoal
Harbours, cuts and narrows 1
- Lefroy Harbour
Points on the shore 31
- Barnfield Point
- Bear Point
- Big Bay Point
- Big Cedar Point
- Black Point
- Brechin Point
- Cedar Point
- Champlain Point
- Concord Point
- De Grassi Point
- Deep Point
- Duclos Point
- Eight Mile Point
- Ferguson Point
- Four Mile Point
- Gamebridge Point
- Invermara Point
- Jacksons Point
- Leacock Point
- Little Cedar Point
- Mara Point
- McGinnis Point
- McRae Point
- Minet's Point
- Mossington Point
- Orchard Point
- Plumb Point
- Prophet Point
- Roches Point
- Sibbald Point
- Victoria Point
Communities on the lake 20
- Barrie
- Orillia
- Keswick
- Sutton
- Jacksons Point
- Beaverton
- Atherley
- Hawkestone
- Shanty Bay
- Alcona
- Lefroy
- Pefferlaw
- Big Bay Point
- Virginia Beach
- Lagoon City
- Oro Station
- Port Bolster
- Willow Beach
- Bell Ewart
- Island Grove
Nearby lakes
- Bass Lake23 km away
- Lake Couchiching31 km away
- Canal Lake36 km away
- Dalrymple Lake36 km away
Questions about Lake Simcoe
- How deep is Lake Simcoe?
Its deepest charted contour is 41 meters, and the water within it is deeper.
- How big is Lake Simcoe?
Its surface covers 723.0 square kilometers and it holds 31 islands. Of its 303 kilometers of shoreline, 254 kilometers is the mainland shore and 49 kilometers is the shore of the islands.
- What fish are in Lake Simcoe?
Ontario’s aquatic resource records name 66 species, among them lake trout, walleye, smallmouth bass, largemouth bass, northern pike and muskellunge.
- Is the water clear?
All two monitoring sites with a phosphorus status are classified mesotrophic, the middle of the province’s three bands.
- Is there a public boat launch?
Records mark nine boat launches, four shoreline access points, 22 marinas and nineteen beaches on Lake Simcoe. The province’s fishing access register has not been read for this lake.
- How warm is Lake Simcoe in summer?
At the province’s stations the water at one meter has read between 19.1 and 24.1 degrees in late July and early August in most years since 1980, with a median of 22.1 in late July. The deep water stays under 10 degrees all summer.
The Lake Simcoe sheet, on your wall
This map is available as a print in two colourways, unframed or framed, printed in Canada, or as a digital file for printing yourself.
Framed from $139 · free shipping in Canada · personalization available
Order the Lake Simcoe printLooking at a property on Lake Simcoe?
Depth and water quality are two records out of many. Our Rural & Cottage Buyer’s Report gathers what the public record holds about one specific address: shore road allowance, road access, wells, flood mapping, Crown land, wetlands and more, read and checked by a person before it is sent.
What these figures do and do not say
- Depth
- A depth reading is the distance from the water surface on the day of survey to the lake bottom. Lake levels vary through the season and between years. The depth figure above is the deepest contour charted and is a minimum; the depth within it was not recorded.
- Shoreline and surface
- The shoreline figure is the length of the mainland shore and of every island shore added together, measured on the Ontario Hydro Network’s outline of the lake. The surface figure is the area of water inside that outline, less the area of its islands. The provincial outline is mapped to within a few meters of the shore, and a shoreline measured from a coarser map comes out shorter, which is why a figure published elsewhere is often lower.
- Survey coverage
- Not every survey covered every arm of a lake, and the province’s index does not always record where a survey ended. Each lake is checked against the province’s scanned historic survey sheets before drawing.
- Water quality
- Each figure belongs to a single monitoring site and not to the lake as a whole. A bay receiving a creek can read differently from open water half a kilometer away. Sites are matched to Lake Simcoe by name in the province’s records.
- Water access
- These figures count access points on the province’s registers. An unmarked location may simply not have been recorded. The province’s fishing access register has not yet been read for this lake, so the marks shown are the ones already recorded and not a count of what the register holds.
- Nearby lakes
- Distances are measured between lake centres.
- Islands and names
- Islands are counted and measured on the Ontario Hydro Network outline; names are the register’s, placed by its own coordinate. The register names islands the outline draws as part of a larger one, and the outline holds islands the register has not named, so the two counts differ. The outline carries some lakes across marsh, so a gap in the marsh is drawn as land, and every such gap is included in the island count. Where the register has not named one and it lies mostly inside a wetland in the province’s Wetland With Significance dataset, the page names the wetland and the table of largest islands leaves it out. Wetland boundaries are mapped at their own scale and can cover a small island whole.
- Depth contours
- Each contour is drawn where the survey placed it, at the survey’s own positional accuracy. The survey carries its own shoreline, which differs from the Ontario Hydro Network’s outline, so a contour near the shore can run to or past the outline. Such a stretch is drawn along the outline, as a drawing convention, and is not the survey’s line there. The contour count in the stat band is the province’s, and it includes the survey’s own shoreline contour, one ring around the mainland and one around each charted island, which the map leaves off; the map’s small print gives the split.
- Location
- Municipal boundaries are read from the province’s records as published and can lag a boundary change.
- Temperature
- Every temperature and oxygen figure is a reading at a named provincial station on Lake Simcoe, filed by station and by month or half-month; none is an average for the lake, and a bay station and an open-water station sampled on one day do not read the same. The band is a range for the half-month over the years of the record, and no figure on this page is a forecast for a given day. Water below the surface layer is colder than any figure in the band, and cold-water shock can occur in water below about 15 degrees. The oxygen series is readings at one station and is not the Protection Plan’s volume-weighted indicator.
- Fish
- Ontario’s fish records are compilations of existing knowledge from field biologists and do not represent exhaustive inventories. A species that is not listed was not ruled out. The species list carries one date for the whole record and none for any species.
- Spawning areas
- A spawning area is drawn where the province mapped it, at the province’s stated accuracy, and the record says nothing about how many fish use it in a given year. A nest record is one nest seen on one day; a count of nests is not a count of fish, and a count of records is not a comparison between species. Whether a given piece of work needs an authorization is a determination made by Fisheries and Oceans Canada on the work itself.
- Stocking
- A stocking record is a release on a date. It says nothing about how many fish survived or about the population in the lake today.
- Eating advice
- The guide’s advice is for fish taken from the lake at the tested location and applies to the size classes tested. The province’s guide is the authority and is updated each year.
- Fishing rules
- Seasons and limits are the zone’s, for the year of the dataset the page was built from, and a licence’s own conditions and any waterbody exception apply over them. The province’s regulations summary is the authority.
- Ice dates
- A break-up date is the day a lake was recorded as no longer completely covered by ice, and a freeze date is the day it was recorded as completely covered. Both are read from the shore. A winter carrying no date is a winter nobody recorded, and not a winter without ice. The record is read at Kempenfelt Bay at Barrie and a large lake does not freeze or clear everywhere at once. It is read from the shore of a city that grew from about 16,000 people in 1950 to about 150,000 by 2020, and the record does not separate that change from any other.
- Ice hut rules
- Removal dates and registration rules are set by fisheries management zone and change from time to time. The dates here were read from the province in September 2026. The province’s own fishing regulations are the authority.
Where these figures come from
- Depth, shoreline, islands and named places: Ontario Ministry of Natural Resources bathymetry and the Ontario Hydro Network, © King’s Printer for Ontario, Open Government Licence – Ontario. Survey behind the depths: 1957 survey.
- Phosphorus and water clarity: Ontario Lake Partner Program, Ministry of the Environment, Conservation and Parks, Open Government Licence – Ontario. Extract built 2026-08-09.
- Water access marks: Ontario fishing access point records, Open Government Licence – Ontario.
- Aerial photography: Geospatial Ontario imagery, Open Government Licence – Ontario, released collections only.
- Official names: Geographic Names Ontario, Ministry of Natural Resources, Open Government Licence – Ontario. Marinas: Overture Maps Foundation places data, CDLA-Permissive 2.0.
- Lake outline and municipal boundaries: Ontario Hydro Network and Ontario municipal boundary records, Ministry of Natural Resources, Open Government Licence – Ontario.
- Water temperature and dissolved oxygen: Lake Simcoe Monitoring, Ministry of the Environment, Conservation and Parks, Open Government Licence – Ontario, 1980 to 2024. Deep-water oxygen target: Lake Simcoe Protection Plan, 2009.
- Fish species and thermal regime: Ontario Aquatic Resource Area records. Spawning areas: Ontario Fish Activity Area records. Both Ministry of Natural Resources, Open Government Licence – Ontario.
- Stocking: Historical Fish Stocking Data and Fish Stocking Data for Recreational Purposes, Ministry of Natural Resources, Open Government Licence – Ontario.
- Consumption advice: Guide to Eating Ontario Fish advisory database, 2025 edition, Ministry of the Environment, Conservation and Parks, Open Government Licence – Ontario.
- Seasons and limits: Ontario recreational fishing regulations data, Ministry of Natural Resources, Open Government Licence – Ontario.
- Fish plates: Duane Raver, U.S. Fish and Wildlife Service; Ellen Edmonson and Hugh Chrisp, New York State Conservation Department; Timothy Knepp, U.S. Fish and Wildlife Service; U.S. Fish and Wildlife Service. All public domain.
- Ice dates: Alex Mills, York University. 2025. "Lake Simcoe Kempenfelt Bay Ice Data" (dataset). 2.0.0. DataStream. https://doi.org/10.25976/qcvg-5a23. Contains information from Lake Simcoe Kempenfelt Bay Ice Data which is made available under the ODC Attribution License.
- Ice hut removal dates and registration: Ontario fishing regulations, read September 2026.